Download
1 / 19
190 likes | 323 Views
Toll Modeling Analysis for the SR 520 Bridge Replacement and HOV Project. 19 th Annual International EMME/2 Users’ Conference October 19-21, 2005 Presented by: Nicola Longo. Authors: Nicola Longo, P.E., PB Sujay Davuluri, PB Anjali Bhagat, PB Madhavi Sanakkayala, PB

E N D
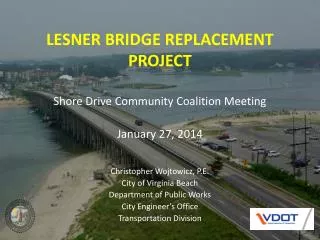
Toll Modeling Analysis for the SR 520 Bridge Replacement and HOV Project 19th Annual International EMME/2 Users’ Conference October 19-21, 2005 Presented by: Nicola Longo
Authors: Nicola Longo, P.E., PB Sujay Davuluri, PB Anjali Bhagat, PB Madhavi Sanakkayala, PB Michael Horntvedt, Parametrix Acknowledgements: Julie Meredith, P.E., WSDOT Project Manager
Presentation Overview • Project Background • Project Alternatives • Modeling Procedures • Summary of Findings
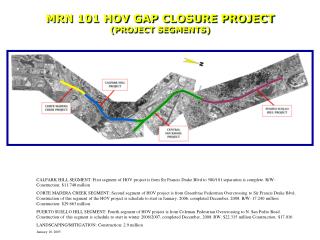
Project Background • History • Bridge opened in 1963 as a tolled facility • Toll removed in 1979 • Study Area • Seven mile corridor from I-5 to I-405
Project Background • Goal Improve mobility for people and goods across Lake Washington in a manner that is safe, reliable, and cost effective • Project Status WSDOT is currently preparing a DEIS We'll be in touch,
Project Background • Traffic Volumes ~ 110,000 daily vehicles trips on an average weekday
Project Background • Alternative Routes I-90 and SR 522
Project Alternatives Using the EMME/2 Puget Sound Regional Council Model the following alternatives were analyzed: • 1998 Base Year • SR 520 - 2 GP / direction • Model was refined, updated and validated • 2030 No Build • SR 520 - 2 GP / direction • Included planned improvements only
Project Alternatives • 2030 4-Lane • SR 520 - 2 GP / direction • Non carpool are tolled • Transit and HOV are toll free • 2030 6-Lane • SR 520 - 2 GP / direction and 1 HOV / direction • Non carpool are tolled • Transit and HOV are toll free • 2030 8-Lane • SR 520 - 3 GP / direction and 1 HOV / direction • Non carpool are tolled • Transit and HOV are toll free • Additional capacity on I-5
Modeling Procedures Base Model • Existing 4-step PSRC model • VDFs and GC assignment procedure from the new PSRC model • Performed mini-validation analysis for study corridor
Modeling Procedures Mini Validation • Updated network attributes: • Coding Refinement (capacity, FFS, number of lanes, turning movements, etc) • Transit Service Level • Transit and auto vehicle volumes within 10% of actual volumes for cross-lake Comparison of Daily Vehicle Volumes
Modeling Procedures General Procedure Two-step process: • Established trip distribution using a full model run without tolls • Used resulting trip distribution to perform mode choice and assignments inclusive of tolls and feedback
Modeling Procedures Different WSDOT study provided key inputs • Value of Time (VOT) in 1990 dollars • Used survey data • Performed statistical mode choice estimate analysis • Toll Rates in 1990 dollars • Special modeling analysis performed to establish toll rates
Modeling Procedures Generalized Cost Assignment • Toll Rates • Peaks = 250 cents • Off Peak = 135 cents • VOT • Peak factor = (1/10.8) x 60/100 = 0.0555 min/cents • Off-peak factor = (1/9.1) x 60/100 =0.0659 min/cents
Modeling Procedures Production of “Pure” Travel Times • GC based times include toll time costs • Used GC based link volumes to calculate “pure” travel times
Modeling Procedures Mode Choice Model Inputs • “Pure” travel time: • 3+ HOVs • Transit • “Pure” travel time + Toll Time Cost: • Non-HOVs using GP lanes
Model Results • Systemwide mode share • PM peak and daily cross-lake screenline • Detailed traffic data for micro simulation analysis
Conclusions • Special studies required for estimates of VOT and toll rates • New VDFs and GC procedures were useful for more accurate forecasts • Results assisted to evaluate alternatives effectively