Download
1 / 19
190 likes | 288 Views
This comprehensive guide helps new parents master parenthood while maintaining their competence in different areas. It covers practical tips, emotional support, and key strategies to balance parenting responsibilities with personal growth.

E N D
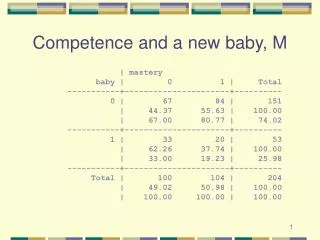
Competence and a new baby, M | mastery baby | 0 1 | Total -----------+----------------------+---------- 0 | 67 84 | 151 | 44.37 55.63 | 100.00 | 67.00 80.77 | 74.02 -----------+----------------------+---------- 1 | 33 20 | 53 | 62.26 37.74 | 100.00 | 33.00 19.23 | 25.98 -----------+----------------------+---------- Total | 100 104 | 204 | 49.02 50.98 | 100.00 | 100.00 100.00 | 100.00
Competence and a new baby, F | mastery baby | 0 1 | Total -----------+----------------------+---------- 0 | 74 77 | 151 | 49.01 50.99 | 100.00 | 73.27 74.76 | 74.02 -----------+----------------------+---------- 1 | 27 26 | 53 | 50.94 49.06 | 100.00 | 26.73 25.24 | 25.98 -----------+----------------------+---------- Total | 101 103 | 204 | 49.51 50.49 | 100.00 | 100.00 100.00 | 100.00
Depression and a new baby, M | depress baby | 0 1 | Total -----------+----------------------+---------- 0 | 92 59 | 151 | 60.93 39.07 | 100.00 | 75.41 71.95 | 74.02 -----------+----------------------+---------- 1 | 30 23 | 53 | 56.60 43.40 | 100.00 | 24.59 28.05 | 25.98 -----------+----------------------+---------- Total | 122 82 | 204 | 59.80 40.20 | 100.00 | 100.00 100.00 | 100.00
Depression and a new baby, F | depress baby | 0 1 | Total -----------+----------------------+---------- 0 | 91 60 | 151 | 60.26 39.74 | 100.00 | 76.47 70.59 | 74.02 -----------+----------------------+---------- 1 | 28 25 | 53 | 52.83 47.17 | 100.00 | 23.53 29.41 | 25.98 -----------+----------------------+---------- Total | 119 85 | 204 | 58.33 41.67 | 100.00 | 100.00 100.00 | 100.00
Central Limit Theorem • Know the sampling distribution of means from properties of the population • Mean of sampling distribution of means is mean of the population • Standard deviation of sampling distribution of means is times sd of population • Sampling distribution is normal
.4 .3 .2 norm .1 0 -3 -2 -1 0 1 2 3 x Normal Distribution 95% Mean Standard deviation
Normal Probabilities z p 1. -3 .0013499 2. -2 .0227501 3. -1 .1586553 4. 0 .5 5. 1 .8413448 6. 2 .9772499 7. 3 .9986501 Z score Why we have a normal table!!!
Translation Mean = 0 sd = 1 0 1 2 3 100 116 132 148 Mean = 100 sd = 16
Translation (part 1) • Original metric of variable, IQ: mean is 100, std. dev. is 16 • New metric (z score), mean is 0, std. dev. is 1. • To make the new variable, z, have a mean of zero, subtract the mean of the old variable from all observations
Translation (part 2) • To make the new variable, z, have a standard deviation of 1, divide each deviation by the sd of X
Translation (Part 3) 100 116 132 148 Mean = 100, sd = 16 Subtract mean of 100 16 32 48 Mean = 0, sd = 16 0 Divide by sd of 16 Mean = 0, sd = 1 0 1 2 3 The order in which you do these steps is important!
Not all distributions are normal • We have already looked at the binomial • The same principles hold in looking at the binomial distribution. The formulae are different.
Binomial example • Let p = .3 and n = 7 • In this case f can be 0,1,2,3,4,5,6, or 7 • This creates a discrete distribution with a probability for each separate outcome .082
Binomial example (cont.) 7 .3 .118 = .247 21 .09 .168 = .318
Binomial Results f comb pf qnf p 0 1 1 .0823543 .082 1 7 .3 .117649 .247 2 21 .09 .16807 .317 3 35 .027 .2401 .226 4 35 .0081 .343 .097 5 21 .00243 .49 .025 6 7 .000729 .7 .004
Binomial • Normal approximation with large sample • A large sample? np/q > 9 & nq/p > 9 • If p=.3 then n > 21
Binomial with p = .32, n = 21 Note normal curve Mean = np = 6.3 Sd = sqrt(npq) = 2.1