One Sample Mean Inference (Chapter 5)
One Sample Mean Inference (Chapter 5). In Unit 2 we will discuss:. How to estimate the mean from a normal distribution and compute a 95% confidence interval for the true unknown population mean. How to statistically test whether the population sampled could have a specified population mean.

One Sample Mean Inference (Chapter 5)
E N D
Presentation Transcript
One Sample Mean Inference(Chapter 5) In Unit 2 we will discuss: • How to estimate the mean from a normal distribution and compute a 95% confidence interval for the true unknown population mean. • How to statistically test whether the population sampled could have a specified population mean. • The five parts of a statistical test. • Type I and Type II errors associated with testing. • In general how sample size is determined. • Inferences about the median.
Inferences about the population mean, m Sample Estimates Test a Hypothesis Decision Sampling Distribution of Interval Estimate of mands. Population Parameters Central Limit Theorem
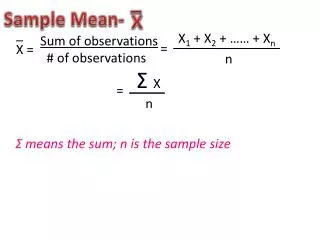
Estimation of the Population Mean, m. The Central Limit Theorems tell us the shape of the sampling distribution Point Estimate of mis the sample mean: 95% of sample means expected to lie in this interval. 2.5% of sample means expected to lie in this interval. 2.5% of sample means expected to lie in this interval. m -1.96 m m +1.96 Interval Estimate of mis the confidence interval:
Interval Estimate of the Population Mean The event m m is equivalent to the event
Meaning of a 95% Confidence Interval In repeated sampling, the interval would encompass the true parameter value 95% of the time. m 5% of the intervals don’t include the true mean. 95% of the intervals include the true mean.
Critical Value for Confidence Interval 95% Confidence Interval 99% Confidence Interval (1-α)100% Confidence Interval • The a/2 critical value of the standard normal distribution. • The value of the standard normal distribution for which P(z>z a/2 )= a/2 . Read from Table 1 in Ott
Using an Estimate of s What if we don’t know the value of ? We simply replace s with its estimate s in the confidence interval equation. However, the resulting sampling distribution is no longer normal, but follows a t distribution instead. This involves replacing the normal critical value, za/2, with a critical value from a t distribution, ta/2,n-1 (more on this later). If n is large (30 or more), it turns out that because of the Central Limit Theorem the normal is a good enough approximation to the t, and we can therefore use za/2, after all.
Example In a large amount of repeated sampling, 99 out of 100 intervals constructed this way would include the true mean. In a large amount of repeated sampling, 95 out of 100 intervals constructed this way would include the true mean.
Sample Size Determination The CI equation can be turned around to allow computation of the sample size needed to estimate the true mean with a specified level of precision and confidence. Typical Confidence Levels 90% 95% 99% • Need three things: • 1) Target level of confidence: (1-)100% • 2) Tolerable margin of error (half of CI width): E • 3) Estimate of population standard deviation: s Target Precision i) Prior Knowledge ii) Pilot Sample iii) Expert Guess (range/4)
100(1-a)% CI for m Equate this to E. voilá Precision can be specified relative to s. Equate the CI precision to the target precision and solve for n.
Sample Size Example Take home message: If you have some idea of the underlying variability in the population and you know roughly how precise you wish the mean estimate to be you can compute the required sample size.