Download
1 / 20
210 likes | 358 Views
Inference for One-Sample Means. Steps for doing a confidence interval:. State the parameter Conditions 1) The sample should be chosen randomly 2) The sample distribution should be approximately normal - the population is known to be normal, or

E N D
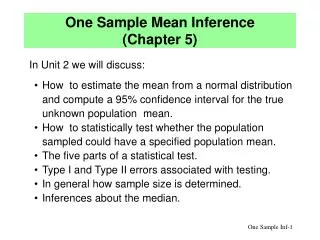
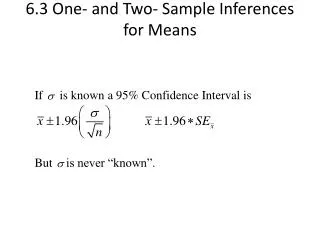
Steps for doing a confidence interval: • State the parameter • Conditions • 1) The sample should be chosen randomly • 2) The sample distribution should be approximately normal • - the population is known to be normal, or • - the sample size is large (n 30) (CLT), or • - graph data to show approximately normal • 3) 10% rule – The sample should be less than 10% of the population • 4) σ is known (or unknown) 3) Calculate the interval • If σ is known we perform a z-interval • If σ is unknown we perform a t-interval 4) Write a statement about the interval in the context of the problem.
Confidence interval for a population mean (z-interval): Standard deviation of the statistic Critical value estimate Margin of error
Formula for a t-confidence interval: Standard deviation of statistic Critical value estimate Degrees of freedom Margin of error
In a randomized comparative experiment on the effects of calcium on blood pressure, researchers divided 54 healthy, white males at random into two groups, takes calcium or placebo. The paper reports a mean seated systolic blood pressure of 114.9 with standard deviation of 9.3 for the placebo group. Find a 95% confidence interval for the true mean systolic blood pressure of the placebo group.
State the parameters μ = the true mean systolic blood pressure of healthy white males Justify the confidence interval needed (state assumptions) 1) The sample must be random which is stated in the problem. 2) The sample distribution should be approximately normal. Since n = 54 >30, by the CLT we can assume the sample distribution is approximately normal. 3) The sample should be less than 10% of the population. The population should be at least 540 healthy white males, which I will assume. 4) is unknown Since the conditions are satisfied a t – interval for means is appropriate.
Calculate the confidence interval. 95% CI Explain the interval in the context of the problem. We are 95% confident that the true mean systolic blood pressure for healthy white males is between 112.36 and 117.44.
Steps for a hypothesis test : • Define the parameter • Hypothesis statements • Assumptions • Calculations (Find the p-value) • Decision and Conclusion,
Conditions for one-sample means 1) The sample should be chosen randomly 2) The sample distribution should be approximately normal - the population is known to be normal, or - the sample size is large (n 30) (CLT), or - graph data to show approximately normal (normal probability plot and box plot) 3) 10% rule – The sample should be less than 10% of the population 4) σ is known or unknown If σ is known we perform a z-test If σ is unknown we perform t-test
Formulas: s known: z =
Formulas: s unknown: t =
Example 2 The Fritzi Cheese Company buys milk from several suppliers as the essential raw material for its cheese. Fritzi suspects that some producers are adding water to their milk to increase their profits. Excess water can be detected by determining the freezing point of milk. The freezing temperature of natural milk varies normally, with a mean of -0.545 degrees and a standard deviation of 0.008. Added water raises the freezing temperature toward 0 degrees, the freezing point of water (in Celsius). The laboratory manager measures the freezing temperature of five randomly selected lots of milk from one producer with a mean of -0.538 degrees. Is there sufficient evidence to suggest that this producer is adding water to his milk?
Parameters and Hypotheses μ = the true mean freezing temperature of milk H0: μ = -0.545 Ha: μ > -0.545 Assumptions (Conditions) 1) The sample must be random which is stated in the problem. 2) The sample distribution should be approximately normal. Since it is stated in the problem that the population is normal then the sample distribution is normal. 3) The sample should be less than 10% of the population. The population should be at least 50 lots of milk, which I will assume. 4) is known Since the conditions are met, a z-test for the one-sample means is appropriate.
Calculations = 0.05
Decision: Since p-value < a, I reject the null hypothesis at the .05 level. Conclusion: There is sufficient evidence to suggest that the true mean freezing temperature is greater than -0.545. This suggests that the producer is adding water to the milk.
Example 3 (page 545 #33) In 1998, as an advertising campaign, the Nabisco Company announced a “1000 Chips Challenge,” claiming that every 19-ounce bag of their Chips Ahoy cookies contained at least 1000 chocolate chips. Dedicated Statistics students at the Air Force Academy (no kidding) purchased some randomly selected bags of cookies, and counted the chocolate chips. Some of their data are give below. What does this say about Nabisco’s claim. Test an appropriate hypothesis.
Parameters and Hypotheses μ = the true mean number of chocolate chips in each bag of Chips Ahoy H0: μ = 1000 Ha: μ > 1000
Assumptions (Conditions) 1) The sample must be random which is stated in the problem. 2) The sample distribution should be approximately normal. The normal probability plot is fairly linear and the boxplot shows no outliers, so we will assume that the sample distribution is approximately normal. 3) The sample should be less than 10% of the population. The population should be at least 160 bags of Chips Ahoy, which we will assume. 4) is unknown Since the conditions are met, a t-test for the one-sample means is appropriate.
Calculations 1238.1875 94.282 1238.1875 94.282 = 0.05
Decision: Since p-value < a, I reject the null hypothesis at the .05 level. Conclusion: There is sufficient evidence to suggest that the true mean number of chocolate chips in each bag of Chips Ahoy is greater than 1000.