Data Warehouses and OLAP
630 likes | 944 Views
Data Warehouses and OLAP. *Slides by Nikos Mamoulis. Data Warehousing and OLAP Technology for Data Mining. What is a data warehouse? A multi-dimensional data model Data warehouse architecture Data warehouse implementation Further development of data cube technology

Data Warehouses and OLAP
E N D
Presentation Transcript
Data Warehouses and OLAP *Slides by Nikos Mamoulis
Data Warehousing and OLAP Technology for Data Mining • What is a data warehouse? • A multi-dimensional data model • Data warehouse architecture • Data warehouse implementation • Further development of data cube technology • From data warehousing to data mining
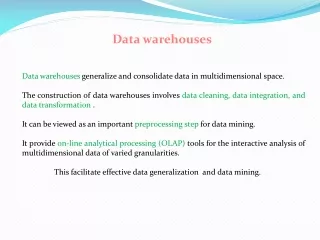
Why Data Warehousing? • Data warehousing can be considered as an important preprocessing step for data mining • A data warehouse also provides on-line analytical processing (OLAP) tools for interactivemultidimensional data analysis. Heterogeneous Databases data selection Data Warehouse data cleaning data integration data summarization
Example of a Data Warehouse (1) US-Database Data Warehouse Employee Department FACT table Transaction Details dimension 1: time HK-Database Supplier Country dimension 2: product Sales
Example of a Data Warehouse (2) • Data Selection • Only data which are important for analysis are selected (e.g., information about employees, departments, etc. are not stored in the warehouse) • Therefore the data warehouse is subject-oriented • Data Integration • Consistency of attribute names • Consistency of attribute data types. (e.g., dates are converted to a consistent format) • Consistency of values (e.g., product-ids are converted to correspond to the same products from both sources) • Integration of data (e.g, data from both sources are integrated into the warehouse)
Example of a Data Warehouse (3) • Data Cleaning • Tuples which are incomplete or logically inconsistent are cleaned • Data Summarization • Values are summarized according to the desired level of analysis • For example, HK database records the daytime a sales transaction takes place, but the most detailed time unit we are interested for analysis is the day.
Example of a Data Warehouse (4) • Example of an OLAP query (collects counts) • Summarize all company sales according to product and year, and further aggregate on each of these dimensions. year 1999 2000 2001 2002 ALL chairs tables Data cube desks product shelves boards ALL
What is Data Warehouse? • Defined in many different ways, but not rigorously. • A decision support database that is maintained separatelyfrom the organization’s operational database • Support information processing by providing a solid platform of consolidated, historical data for analysis. • “A data warehouse is a subject-oriented,integrated, time-variant, and nonvolatilecollection of data in support of management’s decision-making process.”—W. H. Inmon • Data warehousing: • The process of constructing and using data warehouses
Data Warehouse—Subject-Oriented • Organized around major subjects, such as customer, product, sales. • Focusing on the modeling and analysis of data for decision makers, not on daily operations or transaction processing. • Provide a simple and concise view around particular subject issues by excluding data that are not useful in the decision support process.
Data Warehouse—Integrated • Constructed by integrating multiple, heterogeneous data sources • relational databases, flat files, on-line transaction records • Data cleaning and data integration techniques are applied. • Ensure consistency in naming conventions, encoding structures, attribute measures, etc. among different data sources • E.g., Hotel price: currency, tax, breakfast covered, etc. • When data is moved to the warehouse, it is converted.
Data Warehouse—Time Variant • The time horizon for the data warehouse is significantly longer than that of operational systems. • Operational database: current value data. • Data warehouse data: provide information from a historical perspective (e.g., past 5-10 years) • Every key structure in the data warehouse • Contains an element of time, explicitly or implicitly • But the key of operational data may or may not contain “time element” (the time elements could be extracted from log files of transactions)
Data Warehouse—Non-Volatile • A physically separate store of data transformed from the operational environment. • Operational update of data does not occur in the data warehouse environment. • Does not require transaction processing, recovery, and concurrency control mechanisms • Requires only two operations in data accessing: • initial loading of data and access of data.
Data Warehouse vs. Heterogeneous DBMS • Traditional heterogeneous DB integration: • Build wrappers/mediators on top of heterogeneous databases • Query driven approach • When a query is posed to a client site, a meta-dictionary is used to translate the query into queries appropriate for individual heterogeneous sites involved, and the results are integrated into a global answer set • Complex information filtering, compete for resources • Data warehouse: update-driven, high performance • Information from heterogeneous sources is integrated in advance and stored in warehouses for direct query and analysis
Data Warehouse vs. Heterogeneous DBMS • Example of a Heterogeneous DBMS • The results from the various sources are integrated and returned to the user Heterogeneous Databases mediator/ wrapper R1 Q1 meta- data results user R2 Q2 query R3 querytransformation Q3
Data Warehouse vs. Heterogeneous DBMS • Advantages of a Data Warehouse: • The information is integrated in advance, therefore there is no overhead for (i) querying the sources and (ii) combining the results • There is no interference with the processing at local sources (a local source may go offline) • Some information is already summarized in the warehouse, so query effort is reduced. • When should mediators be used? • When queries apply on current data and the information is highly dynamic (changes are very frequent). • When the local sources are not collaborative.
Data Warehouse vs. Operational DBMS • OLTP (on-line transaction processing) • Major task of traditional relational DBMS • Day-to-day operations: purchasing, inventory, banking, manufacturing, payroll, registration, accounting, etc. • OLAP (on-line analytical processing) • Major task of data warehouse system • Data analysis and decision making • Distinct features (OLTP vs. OLAP): • User and system orientation: customer vs. market • Data contents: current, detailed vs. historical, consolidated • Database design: ER + application vs. star + subject • View: current, local vs. evolutionary, integrated • Access patterns: update vs. read-only but complex queries
Why Separate Data Warehouse? • High performance for both systems • DBMS— tuned for OLTP: access methods, indexing, concurrency control, recovery • Warehouse—tuned for OLAP: complex OLAP queries, multidimensional view, consolidation. • Different functions and different data: • missing data: Decision support requires historical data which operational DBs do not typically maintain • data consolidation: DS requires consolidation (aggregation, summarization) of data from heterogeneous sources • data quality: different sources typically use inconsistent data representations, codes and formats which have to be reconciled
Data Warehousing and OLAP Technology for Data Mining • What is a data warehouse? • A multi-dimensional data model • Data warehouse architecture • Data warehouse implementation • Further development of data cube technology • From data warehousing to data mining
From Tables and Spreadsheets to Data Cubes • A data warehouse is based on a multidimensional datamodel which views data in the form of a data cube • A data cube, such as sales, allows data to be modeled and viewed in multiple dimensions • Dimension tables, such as item (item_name, brand, type),ortime(day, week, month, quarter, year) • Fact table contains measures (such as dollars_sold) and keys to each of the related dimension tables
From Tables and Spreadsheets to Data Cubes • A dimension is a perspective with respect to which we analyze the data • A multidimensional data model is usually organized around a central theme (e.g., sales). Numerical measures on this theme are called facts, and they are used to analyze the relationships between the dimensions • Example: • Central theme: sales • Dimensions: item, customer, time, location, supplier, etc.
What is a data cube? • The data cube summarizes the measure with respect to a set of n dimensions and provides summarizations for all subsets of them year 1999 2000 2001 2002 ALL chairs tables Data cube product desks shelves boards ALL
What is a data cube? • In data warehousing literature, the most detailed part of the cube is called a base cuboid. The top most 0-D cuboid, which holds the highest-level of summarization, is called the apex cuboid. The lattice of cuboids forms a data cube. year base cuboid 1999 2000 2001 2002 ALL chairs tables Data cube product desks shelves apex cuboid boards ALL
Cube: A Lattice of Cuboids all 0-D(apex) cuboid time item location supplier 1-D cuboids time,item time,location item,location location,supplier 2-D cuboids time,supplier item,supplier time,location,supplier time,item,location 3-D cuboids item,location,supplier time,item,supplier 4-D(base) cuboid time, item, location, supplier
Conceptual Modeling of Data Warehouses • The ER model is used for relational database design. For data warehouse design we need a concise, subject-oriented schema that facilitates data analysis. • Modeling data warehouses: dimensions & measures • Star schema: A fact table in the middle connected to a set of dimension tables • Snowflake schema: A refinement of star schema where some dimensional hierarchy is normalized into a set of smaller dimension tables, forming a shape similar to snowflake • Fact constellations: Multiple fact tables share dimension tables, viewed as a collection of stars, therefore called galaxy schema or fact constellation
item time item_key item_name brand type supplier_type time_key day day_of_the_week month quarter year location branch location_key street city province_or_street country branch_key branch_name branch_type Example of Star Schema foreign keys Sales Fact Table time_key item_key branch_key location_key units_sold dollars_sold avg_sales Measures
supplier item time item_key item_name brand type supplier_key supplier_key supplier_type time_key day day_of_the_week month quarter year location city branch location_key street city_key city_key city province_or_street country branch_key branch_name branch_type Example of Snowflake Schema Sales Fact Table time_key item_key branch_key location_key units_sold dollars_sold avg_sales Measures normalization
item time item_key item_name brand type supplier_type time_key day day_of_the_week month quarter year location location_key street city province_or_street country shipper branch shipper_key shipper_name location_key shipper_type branch_key branch_name branch_type Example of Fact Constellation Shipping Fact Table time_key Sales Fact Table item_key time_key shipper_key item_key from_location branch_key to_location location_key dollars_cost units_sold units_shipped dollars_sold avg_sales Measures
A Data Mining Query Language, DMQL: Language Primitives • Cube Definition (Fact Table) define cube <cube_name> [<dimension_list>]: <measure_list> • Dimension Definition ( Dimension Table ) define dimension <dimension_name> as (<attribute_or_subdimension_list>) • Special Case (Shared Dimension Tables) • First time as “cube definition” • define dimension <dimension_name> as <dimension_name_first_time> in cube <cube_name_first_time>
Defining a Star Schema in DMQL define cube sales_star [time, item, branch, location]: dollars_sold = sum(sales_in_dollars), avg_sales = avg(sales_in_dollars), units_sold = count(*) define dimension time as (time_key, day, day_of_week, month, quarter, year) define dimension item as (item_key, item_name, brand, type, supplier_type) define dimension branch as (branch_key, branch_name, branch_type) define dimension location as (location_key, street, city, province_or_state, country)
Defining a Snowflake Schema in DMQL define cube sales_snowflake [time, item, branch, location]: dollars_sold = sum(sales_in_dollars), avg_sales = avg(sales_in_dollars), units_sold = count(*) define dimension time as (time_key, day, day_of_week, month, quarter, year) define dimension item as (item_key, item_name, brand, type, supplier(supplier_key, supplier_type)) define dimension branch as (branch_key, branch_name, branch_type) define dimension location as (location_key, street, city(city_key, province_or_state, country))
Defining a Fact Constellation in DMQL define cube sales [time, item, branch, location]: dollars_sold = sum(sales_in_dollars), avg_sales = avg(sales_in_dollars), units_sold = count(*) define dimension time as(time_key, day, day_of_week, month, quarter, year) define dimensionitem as(item_key, item_name, brand, type, supplier_type) define dimensionbranch as (branch_key, branch_name, branch_type) define dimension location as (location_key, street, city, province_or_state, country) define cube shipping [time, item, shipper, from_location, to_location]: dollar_cost = sum(cost_in_dollars), unit_shipped = count(*) define dimension time astime in cube sales define dimensionitem asitem in cube sales define dimensionshipper as (shipper_key, shipper_name, locationas location in cube sales, shipper_type) define dimension from_location as location in cube sales define dimension to_location as location in cube sales
Aggregate Functions on Measures: Three Categories • distributive: if the result derived by applying the function to n aggregate values is the same as that derived by applying the function on all the data without partitioning. • E.g., count(), sum(), min(), max(). • algebraic:if it can be computed by an algebraic function with M arguments (where M is a bounded integer), each of which is obtained by applying a distributive aggregate function. • E.g.,avg(), min_N(), standard_deviation(). • holistic: if there is no constant bound on the storage size needed to describe a sub-aggregate. • E.g., median(), mode(), rank().
Aggregate Functions on Measures: Three Categories (Examples) • Table: Sales(itemid, timeid, quantity) • Target: compute an aggregate on quantity • distributive: • To compute sum(quantity) we can first compute sum(quantity) for each item and then add these numbers. • algebraic: • To compute avg(quantity) we can first compute sum(quantity) and count(quantity) and then divide these numbers. • holistic: • To compute median(quantity) we can use neither median(quantity) for each item nor any combination of distributive functions, too.
Concept Hierarchies • A concept hierarchy is a hierarchy of conceptual relationships for a specific dimension, mapping low-level concepts to high-level concepts • Typically, a multidimensional view of the summarized data has one concept from the hierarchy for each selected dimension • Example: • General concept: Analyze the total sales with respect to item, location, and time • View 1: <itemid, city, month> • View 2: <item_type, country, week> • View 3: <item_color, state, year> • ....
A Concept Hierarchy: Dimension (location) all all Europe ... North_America region Germany ... Spain Canada ... Mexico country Vancouver ... city Frankfurt ... Toronto L. Chan ... M. Wind office
Specification of hierarchies Schema hierarchy day < {month < quarter; week} < year Set_grouping hierarchy {1..10} < inexpensive View of Warehouses and Hierarchies
Multidimensional Data • Sales volume as a function of product, month, and region Dimensions: Product, Location, Time Hierarchical summarization paths Region Industry Region Year Category Country Quarter Product City Month Week Office Day Product total order Month partial order (lattice)
Date 2Qtr 1Qtr sum 3Qtr 4Qtr TV Product U.S.A PC VCR sum Canada Country Mexico sum All, All, All A Sample Data Cube Total annual sales of TV in U.S.A.
Cuboids Corresponding to the Cube all 0-D(apex) cuboid country product date 1-D cuboids product,date product,country date, country 2-D cuboids 3-D(base) cuboid product, date, country The cuboids are also called multidimensional views
f size color color; size DataCube example ‘color’, ‘size’: DIMENSIONS ‘count’: MEASURE
DataCubes ‘color’, ‘size’: DIMENSIONS ‘count’: MEASURE f size color color; size
DataCubes ‘color’, ‘size’: DIMENSIONS ‘count’: MEASURE f size color color; size
DataCubes ‘color’, ‘size’: DIMENSIONS ‘count’: MEASURE f size color color; size
DataCubes ‘color’, ‘size’: DIMENSIONS ‘count’: MEASURE f size color color; size
DataCubes ‘color’, ‘size’: DIMENSIONS ‘count’: MEASURE f size color color; size DataCube
Browsing a Data Cube • Visualization • OLAP capabilities • Interactive manipulation
Typical OLAP Operations • Browsing between cuboids • Roll up (drill-up): summarize data • by climbing up hierarchy or by reducing a dimension • Drill down (roll down): reverse of roll-up • from higher level summary to lower level summary or detailed data, or introducing new dimensions • Slice and dice: • project and select • Pivot (rotate): • reorient the cube, visualization, 3D to series of 2D planes. • Other operations • drill across: involving (across) more than one fact table • drill through: through the bottom level of the cube to its back-end relational tables (using SQL)
f size color color; size Example of operations on a Datacube
Example of operations on a Datacube Roll-up: • In this example we reduce one dimension • It is possible to climb up one hierarchy • Example (product, city) (product, country) f size color color; size