Download
1 / 33
340 likes | 612 Views
Data Warehouses and OLAP. What are data warehousing systems? Data Warehouse Architecture & Design Multidimensional Data Model ROLAP and MOLAP Systems View Design in Data Warehouses Object-Oriented Data Warehousing Summary and New Aspects. What Is Data Warehousing?.

E N D
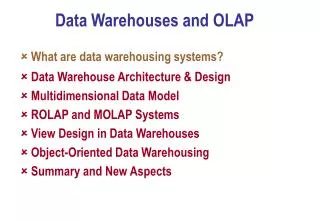
Data Warehouses and OLAP What are data warehousing systems? Data Warehouse Architecture & Design Multidimensional Data Model ROLAP and MOLAP Systems View Design in Data Warehouses Object-Oriented Data Warehousing Summary and New Aspects
What Is Data Warehousing? Data warehousing is a collection of decision support technologies, aimed at enabling the knowledge worker (e.g., chief executive, manager, analyst) to make better and faster decisions. • Chaudhuri and Dayal, SIGMOD Record, March 1997
Characteristics of Data Warehousing Systems • Historical, summarized and consolidated data ; very large databases • Query intensive processing, query throughput and response time driven • Multidimensional model, new operations • ROLAP, MOLAP, Data Marts.
Operational Database Systems • Mainly on-line transaction processing systems. • Have been bread-butter systems for most database system vendors. • Lot of work has gone in building these systems. But these systems have limited decision support functionality (data analysis) required for competitive business environments
Why Need Data Analysis? • to know your customers and yourself better, • for effective business strategies, • to provide future directions to business organizations. This kind of data analysis has been going on for long time. But there is an urgency in getting such data analysis done faster. Main problem in doing this has been the disparate and heterogeneous data sources. Data warehousing systems aim to solve this problem!
Data Warehousing Architecture Monitoring & Administration OLAP Servers Analysis Metadata Repository Query/Reporting External Sources Data Warehouse Extract Transform Serve Data Mining Load Refresh Operational Dbs Tools Data Sources Data Marts Taken from Chaudhri&Dayal, SIGMOD RECORD March 1997
Data Warehouse Design • Define the architecture, do capacity planning, and select storage servers, database and OLAP servers, and tools • Integrate the servers, storage and client tools • Design the warehouse schema and views • Define the physical warehouse organization, data placement, partitioning, and access methods
Data Warehouse Design (Cont..) • Connect the servers using gateways, ODBC drivers, or other wrappers • Design and implement scripts for data extraction, cleaning, transformation, load and refresh • Populate the repository with the schema and view definitions, scripts, and other metadata • Design and implement end-user applications • Roll out the warehouse and applications
Back-end Tools and Utilities • Data Cleansing consists of data migration, data scrubbing and data auditing • Data Loading - consists of checking integrity constraints; sorting; summarization; aggregation and other computation to build derived tables stored in warehouse; building indices and other access paths; and partitioning to multiple target storage areas. • Refresh - data shipping (triggers) vs transaction shipping (based on logs)
Multidimensional Data Model Multidimensional view of data in the warehouse Each dimension is described by a set of attributes; the attributes of a dimension may be related via hierarchy of relationships. Dimensions: Product, City, Date Hierarchical summarization paths Industry Country Year Category State Quarter Product City Month Week Date
On-Line Analytical Processing (OLAP) OLAP tools provide an environment for decision making and business modeling activities by supporting ad hoc queries • provide a multidimensional conceptual view of the data • usually star schema in which a single fact table relates to each dimensional table, or • snowflake schema where dimensional tables are normalized for simplifying the data operations related to the dimension • provide easy-to-use end user interfaces
OLAP (Front-end) Tools Multidimesional data model grew out of the view of business data popularized by PC spread sheet programs. Operations supported by multidimensional data model • Aggregation: total sales by store and by year • Selection (slicing); sales where toys = “soft” and store = “LA” and year=1996 • Roll up (multiple group by): sales by city to sales by state • Drill-down: sales by state to sales by city • Calculation by positioning: top 5 stores by total sales
Star Schema Product ProdNo ProdName ProdDescr Category CategoryDescr UnitPrice QOH Order Fact Table OrderNo OrderDate OrderNo SalespersonID CustomerNo ProdNo DateKey CityName Quantity TotalPrice Customer CustomerNo CustomerName CustomerAddress City Date DateKey Date Month Year Salesperson SalespersonID SalespersonName City Quota City CityName State Country
Relational OLAP (ROLAP) • Stores the data in specialized relational tables (star schema); • ROLAP offers flexibility; cost is the many joins needed for each query • ROLAP extends SQL for decision support data requests • Bitmapped indexes more useful than B-trees in handling large amount of data
Multidimensional OLAP (MOLAP) • Stores data in a N-dimensional cube (hyper cube) using array-based storage structure • each cell is formed by the intersection of all the dimensions; not all cells have a value (eg, not every product is sold in every store) • Cubes are created before can be used and are static • Suited for small and medium data sets
View Design & Data Warehousing • The virtual viewapproach may be better if the information sources are changing frequently; • The materialized viewapproach would be superior if the information sources are changing infrequently and very fast query response time is needed.
A Motivating Example Suppose the member databases contain following tables Item(I_id, I_name, I_price) Part(P_id, P_name, I_id) Supplier(S_id, S_name, P_id, city, cost, preference) Sales(I_id, month, year, amount)
Example continued Assume we have the following frequently asked queries: Q1: Select I_id, sum(amount*I_price) From Item, Sales Where I_name like {MAZADA, NISSEN, TOYOTA} And year=1996 And Item.I_id=Sales.I_id Group by I_id Q2: Select P_id, month, sum(amount) From Item, Sales, Part Where I_name like {MAZADA, NISSEN, TOYOTA} And year=1996 And Item.I_id=sales.I_id And Part.I_id=Item.I_id Group by P_id, month
Example Continued Q3: Select P_id, min(cost), max(cost) From Part, Supplier Where Part.P_id=Supplier.P_id And P_name like {spark_plug, gas_kit} Group by P_id Q4: Select I_id, sum(amount*min_cost) From Item, Sales, Part Where I_name like {MAZADA, NISSEN, TOYOTA} And year=1996 And Item.I_id=Sales.I_id And Item.I_Id=Part.I_id and Part.P_id = (Select P_id, min(cost) as min_cost From supplier Group by P_id) Group by I_id
An MVPP for the Example 1 2 5 Q4 30k Q2 120k Q4 1.5k 10 Q1 30k 360k result4 result3 360k 1.5k result2 I_id, sum P_id, P_id, month (mincost* amount*no) min(cost) sum(amount*no) result1 max(cost) 36k I_id, sum 3.6b (amount*I_price) tmp tmp8 tmp7 15m 360m tmp3 36m tmp1 1k tmp2 12k tmp5 10k tmp6 50k I_name like {Mazda, Nisson, Toyota} year=“1996” P_id, min(cost) max(cost) p_name like {spark_plug, gas_kit} Item Sales Part Supplier
Different Materialization Strategies Materalized Views Cost of Query Processing Cost of Maintenance Total Cost Item, Sales, Part, Supplier 8b980m860k 8b980m860k 0 tmp3, tmp4, tmp8 7b201m547k 1b350m125k 8b551m672k tmp3, tmp5 416m747k 16b32m204k 16b448m951k tmp3, tmp4, tmp7 7b276m497k 1b220m55k 8b496m552k tmp3, tmp7 8b281m547k 126m122k 8b407m669k result1, result2, result3, result4 1m447k 17b384m934k 17b386m381k
Issues & Problems • Finding all the common subexpressions and combining individual query access plans into one MVPP, such that all the common subexpressions are merged; • Finding a set of intermediate nodes in the MVPP, such that if the members of this set are materialized, the total cost of global query access and view maintenance is minimal.
Algorithms for Materialized View Selection • Algorithms for multiple MVPP design; • a feasible solution - working with individual optimal plans; • generating optimal plan(s) - applying 0-1 integer programming technique. • Given an MVPP, using heuristic rules to find a set of nodes to be materialized so that the total cost is minimal.
Dynamic Materialized View Selection • Monitor the queries being executed over time • Maintain MVPP by incorporating most frequently executed queries (common subexpressions) • Modify MVPP incrementally by executing MVPP generation algorithm (in background) • Decide on the views to be materialized • Reorganize the existing views
Materialized View Selection Costs The dynamic materialized view selection problem has to take into consideration: • Benefit to the query processing cost in future • Cost of maintaining the materialized views • Cost of reorganization
Materialized View Reorganization • Given a set of views V1, V2, …, Vn currently materialized • Let V’1, V’2, …, V’m be the new views that need to be materialized • Need to design algorithms for efficient view reorganization • on-line (concurrency, failure recovery) & off-line (efficiency) algorithms
Relational Schema Product ProdNo ProdName ProdDescr Category CategoryDescr UnitPrice QOH Order Fact Table OrderNo OrderDate OrderNo SalespersonID CustomerNo ProdNo DateKey CityName Quantity TotalPrice Customer CustomerNo CustomerName CustomerAddress City Date DateKey Date Month Year Salesperson SalespersonID SalespersonName City Quota City CityName State Country
An Object Model Order OrderNo Quantity TotalPrice SalesPerson SalesPersonID Quota State City GetRegion() Person Name DateOfBirth Address GetAge() OrderPYCView City OrderPYView Product Year OrderView OrderSet Summarize() Country Date Month Year OrderDate GetDate() Customer CustomerNo Category CategoryName CategoryDescr GetCategName() Product ProdName UnitPrice GetProdName() ISA relationship IS PART-OF relationship
Why Object Oriented Data Warehouse? • Object Identity reduces data redundancy - can it help materialized view maintenance? • Is-a hierarchy facilitates common data objects and methods reuse (overloading) • Class composition hierarchy helps fast traversal using OIDs • Methods facilitate implementation of complex aggregate functions (over complex objects, such as volume of a CAD object)
Efficiency considerations Structural join index hierarchies and class partitioning can facilitate in • Evaluating of multiple path operations • Efficiently processing methods • In calculating multidimensional aggregate operations, such as data cube, and pivoting
Architecture considerations Following issues need to be addressed • Is the preferred architecture OO front-end with relational back-end? • What about OO back end and front-end? • How does one integrate data mining and OO data warehousing components • How does one build distributed object oriented data warehousing systems?
Summary • Data warehousing systems are about 5 years old • Most of the work has concentrated on materialized view maintenance, preliminaries • New aspects of data warehousing have to be considered to build next generation systems • dynamic materialized view design • object-orientation, etc.
Some References Dynamic Materialized View Design/Selection • Timos Sellis group, Stanford Group, CSIRO/HKUST/CityU Object Oriented Data Warehousing • Rundensteiner group, Tore Risch Group, CityU/HKUST, Univ. of South Australia