Download
1 / 43
440 likes | 599 Views
Traffic Safety in Public Transport. Madhav Pai September 7 th , 2012 Director EMBARQ India. 1.3 million traffic deaths per year. Source: OMS. Road traffic injuries are projected to be the 5th leading cause of death globally by 2030. 2004 (actual). 2030 (projected).

E N D
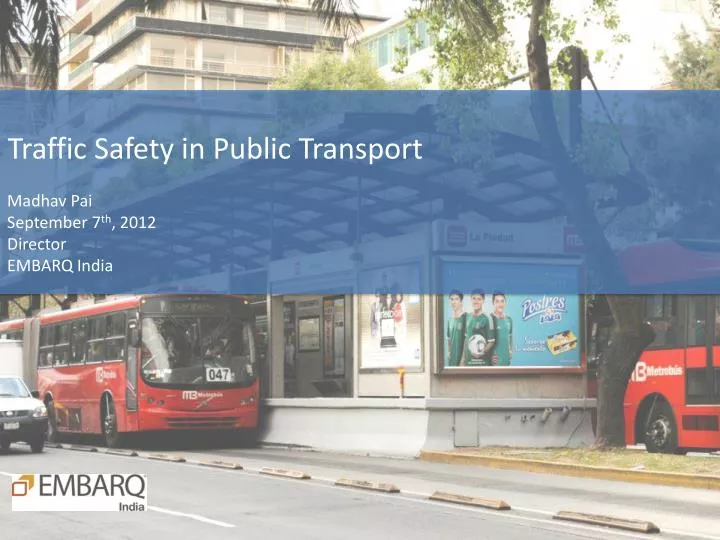
Traffic Safety in Public Transport Madhav Pai September 7th, 2012 Director EMBARQ India
1.3 million traffic deaths per year Source: OMS
Road traffic injuries are projected to be the 5th leading cause of death globally by 2030 2004 (actual) 2030 (projected) Road traffic crashes currently cause more than 1.2 million deaths a year – but by 2030 will kill an estimated 2.4 million people per year
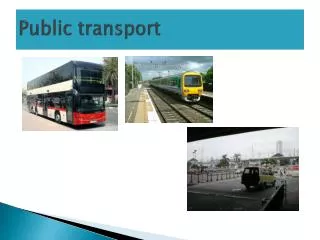
Overview • The importance of considering road safety in public transport • Road safety on BRT and Busway corridors – EMBARQ research
The importance of considering road safety in public transport PT routes located on main arterials – streets with highest crash volume Location of crashes in New York City Source: New York City Pedestrian Safety Study Technical Supplement. Viola et al. 2010 Location of crashes in Benito Juarez, Mexico City Source: Diagnostico espacial de los accidentes de transito En el Distrito Federal.. Chias Becerril et al. 2008
The importance of considering road safety in public transport PT routes located on main arterials – streets with highest crash volume New York City: Streets with bus routes have consistently higher crash rates than all other streets. Viola et al. 2010 Porto Alegre, Brazil: Locations with Busway stations have consistently higher crash rates than all other locations. Diogenes and Lindau 2009.
EMBARQ Research: BRT, Busways, and Road Safety Vancouver Delhi Guadalajara Mexico City Ahmedabad Pereira Cali Belo Horizonte Bogota Curitiba Brisbane Porto Alegre
A diverse mix of various bus systems curbside busway Center lane busway mixed traffic bus route counter-flow busway center lane BRT Center lane counter-flow BRT • How does each of these options rank in terms of road safety? • What are the most frequent types of crashes on each type of bus system? • How can we make them safer ?
Using the model results: Understanding the safety impact of different bus systems • Preliminary safety comparison, based on Mexico City data: • Center lane BRT – safest • Conventional bus service • Curbside bus / microbus lane • Counter-flow bus / microbus lane – most dangerous
Overall safety impact of a BRT Case study: Macrobús, Guadalajara (before)
Overall safety impact of a BRT Case study: Macrobús, Guadalajara (after)
Monthly crashes before and after the implementation of the BRT
Comparison between the bus lanes and the mixed traffic lanes
Main findings: Overall safety impact of a BRT Av. Caracas, TransMilenio
Main findings: Overall safety impact of a BRT / Busway Not all systems have had a positive impact on safety • Cristiano Machado Busway, Belo Horizonte • Central Busway • Corridor with the highest crash frequency citywide • Av. Alcalde Bus Priority Lane, Guadalajara • Curbside bus priority lane • Street with highest crash frequency citywide
Bad design may result in increase in traffic fatalities – Bus corridor in New Delhi
Understanding the factors that influence crash frequencies • Data analysis • Citywide crash frequency models • Analysis of police crash reports • Road safety inspections
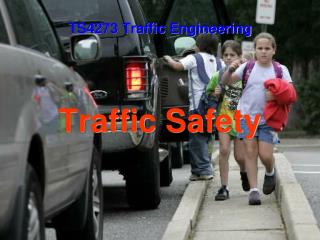
The global picture of safety on BRT and Busways Fatalities by road user type • The safest place to be on a bus corridor is inside the bus • The most dangerous: walking to the bus station Very high risk Very low risk Very high risk
Safety issues on center-lane systems Pedestrians crossing in mid-block Av. Caracas, TransMilenio Metrobus Line 2, Mexico City
Safety issues on center-lane systems Pedestrians running to and from stations Av. Caracas, TransMilenio
Main findings Factors influencing crash frequencies on bus corridors • Speed
Factors influencing crash frequencies Street width and intersection size and complexity • Road width and complexity of intersections were the most important predictors of crash frequencies. Metrobus Line 1, Mexico City
Factors influencing crash frequencies Center-lane systems tend to be safer that curbside ones • Central median • Shorter pedestrian crossings • Fewer mixed traffic lanes • Some 4-way intersections turned into T junctions
Factors influencing crash frequencies Counterflow Counterflow lanes were strongly correlated with higher crash frequencies across all our models (p<0.001)
Main findings Key recommendations for improving safety on bus systems • Street design • Traffic calming • Narrow streets, simple intersections • Short pedestrian crossings • Configuration of the bus system • Closed stations • Physical segregation between bus lanes and mixed traffic lanes • No counterflow
http://www.embarq.org/en/node/4923 Versions in English Spanish Portuguese Get involved!
Safety Guidelines for Indian Cities Abundant property development along the road edge Cars are not the dominant motor-vehicle Bicycles are not the only NMT mode Very high pedestrian volume Traffic discipline cannot be taken as a given Street vendors and immovable obstacles, like utility boxes, trees, temples, etc Auto-rickshaws as the feeder system to BRT
Starting point … India BRT road safety design guidelines www.embarqindia.org
ACCESSIBILITY & Safety Inspections on MASS transit corridors
Indore BRT – Reducing Conflict Points 1 2 3 1 4 2
Elevated Metro – Line One Mumbai • Changing land use pattern. Increasing number of high-rises and retail areas • Un-engineered roads with poor pedestrian infrastructure METRO CORRIDOR ALONG JP ROAD
Elevated Metro – Line One Mumbai • Wasted fringe area • Utilities haphazardly placed on footpath or carriageway
Elevated Metro – Line One Mumbai Recommended Design Consistent width and continuous length for footpath and carriageway Buffer area to be utilised for provision of bus-stops, parking, waiting area, rickshaws 2.1 m : Footpath 2.5 m : Buffer area Bus Stop Parking / Waiting area EB TB 10.6 m BUS BAY 6.0 m : Carriageway 5.7 m : Metro column area 6.0 m : Carriageway BUS BAY 11.2 m Vendors 2.5 m : Buffer area Autorick stand Bus Stop Property Access 2.7 m : Footpath
Thank you Madhav Pai mpai@embarqindia.org