Download
1 / 14
140 likes | 288 Views
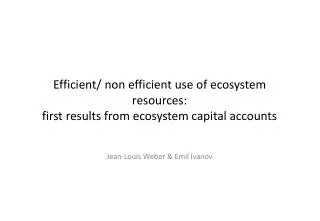
Efficient/ non efficient use of ecosystem resources: first results from ecosystem capital accounts. Jean-Louis Weber & Emil Ivanov.

E N D
Efficient/ non efficient use of ecosystem resources: first results from ecosystem capital accounts Jean-Louis Weber & Emil Ivanov
(Net) Landscape Ecological Potential or LEP: the indicator is made by combining landscape attributes of:- artificiality (built up areas, intensive agriculture…)- natural value (from European and national designations)- fragmentation by main transport networksLEP change is driven by land cover change (LEAC)
NECB Net Primary Production (NPP) Minus Net Resource Use (withdrawals minus returns and leftovers) • Harvest of crops • Harvest of timber • Grazing Minus soil release to the atmosphere (soil respiration, fermentation, VOC…) Minus soil release to water (erosion, leaching…) Plus organic fertilisation Plus/Minus transfers between accouting units = Net Ecosystem Carbon Balance Stock t1 + NECB = Stock t2
Net Primary Production is a measurement of the biomass produced by the vegetation. It is a function of land use, soil and climate (humidity and temperature). NPP values are lower in the North because of temperature and in the South because of lack of water resource.
Net Ecosystem Carbon Balance by 1km2 standard European grid. 2000NECB is the difference between biomass/carbon resources (NPP…) and uses (harvest of timber, crops as well as grazing). NECB is negative where tree clearing has taken place – which will be in general compensated by new vegetation in following years. NECB is very low and sometimes negative in intensive broad pattern agriculture areas – which is a structural deficit reflecting bad resource efficiency (high harvest vs. low NPP resulting from bare soils during several month a year). Consequences are trends to depletion of soil organic carbon (natural fertility) and poor biodiversity. Agriculture areas with mosaic landscape (e.g with hedgerows) have a positive NECB.
Net Ecosystem Carbon Balance by 1km2 standard European grid. 2000NECB is the difference between biomass/carbon resources (NPP…) and uses (harvest of timber, crops as well as grazing). NECB is negative where tree clearing has taken place – which will be in general compensated by new vegetation in following years. NECB is very low and sometimes negative in intensive broad pattern agriculture areas – which is a structural deficit reflecting bad resource efficiency. Agriculture areas with mosaic landscape (e.g with hedgerows) have a positive NECB.
Intensive broad pattern agriculture areasAgriculture areas with mosaic landscape
Biodiversity index: here proportion of BAD/ALL in Art. 17 ReportingIntensive broad pattern agriculture areas have bad performance regarding biodiversity (purple cells) because of low NECB (little biomass left available for biodiversity) and use of chemicals.Agriculture areas with mosaic landscape have not the good performance expected regarding biodiversity (because of hedgerows and positive NECB). The cause is likely to be the use of pesticides…
To produce ecosystem carbon accounts, conventional statistics need to be downscaled to the 1km2 standard European grid. Here: forest statistics of timber harvest
Timber harvest downscaled to the 1km2 standard European grid (red) and forest density (green)
EcosystemCarbon Accounts: Total Use of Biomass/ Carbon by agriculture and forestry
Net Ecosystem Carbon Balance 2000 by ecosystem accounting units