Chapter 11: Polar Coordinates and Complex Numbers
190 likes | 1.17k Views
Chapter 11: Polar Coordinates and Complex Numbers. L11.1 Polar Coordinates and Graphs. POLAR COORDINATES. Polar Coordinates offer another way to locate a point on a plane. Applications: radar, GPS, . Rectangular Coord System:. Polar Coordinate System has: a point, O , called the pole

Chapter 11: Polar Coordinates and Complex Numbers
E N D
Presentation Transcript
Chapter 11: Polar Coordinates and Complex Numbers L11.1 Polar Coordinates and Graphs
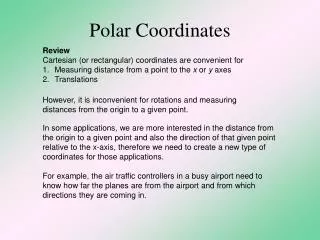
POLAR COORDINATES Polar Coordinates offer another way to locate a point on a plane. Applications: radar, GPS, ... Rectangular Coord System: Polar Coordinate System has: • a point, O, called the pole • an initial ray from O called the polar axis Each point, P, in the plane can be assigned a polor coord (r, θ) Lesson 11.1: • Plotting points in the Polar Coordinate System • Coordinate conversion (Polar ↔ Rectangular) • Sketching Polar Graphs (Graphing equations, recognizing patterns) • Equation conversion (Polar ↔ Rectangular) ~ origin ~ positive x-axis P r is directed distance from O (pole) r θ is directed angle from polar axis θ pole polar axis
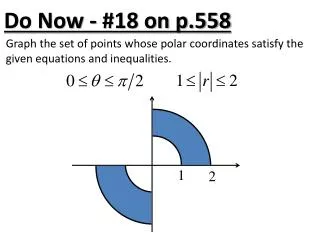
I. Plotting points in the Polar Coordinate System The point (2, π/3) lies at the intersection of a circle with radius 2, and the terminal side of the angle π/3: Plot these: 1. (1, 3π/4), 2. (3, 210°) Unlike the rectangular coordinate system, a point in the polar coordinate system can have multiple representations: (r, θ) = (r, θ ± 2πn), n is an integer Thus, (2, π/3) = (2, 7π/3) = (2, −5π/3) = … If r < 0, find the ray that forms the angle with the polar axis and go in the opposite direction from the ray. For ex, (−2, π/3): Thus (−2, π/3) = (2, 4π/3) (−r, θ) = (r, θ ± π)
II. Coordinate conversion (Polar ↔ Rectangular) y y P(x, y) P(x, y) r r y y ɵ O O x x x x Recall the circular definitions from Chapter 7: Convert from polar to rectangular: Ex. Convert (2, π) to rectangular coordinates. Convert from rectangular to polar: Ex: Convert (−1 , 1) to polar coordinates. x2 + y2 = r2 x = 2 cos π = −2, y = 2 sin π = 0, thus (−2, 0) On Ti89: MATH → Angle P►Rx( P►Ry( R►Pr( R►Pθ( Thus, Polar→Rect tan θ = 1/−1= −1, θ is in Q2, so θ = 3π/4. Rect→Polar
I & II. Polar Coordinates: Examples • Plot these points, write in another polar form and convert to rectangular form: • (3, π/4) • (−⅔, 7π/6) • Convert to polar coordinate form, and provide 2 additional equivalent polar representations: • (−4, 3) • (2, −4) (r, θ) = (r, θ ± 2πn), n is an integer (−r, θ) = (r, θ ± π) Ready for answers?
III. Sketching Polar Graphs • To graph an equation in the rectangular system, plot y in terms of x; i.e., y = f(x). • Create an x/y table, fixing x values and computing corresponding y values. Then connect the dots. • You also use knowledge of the equation to guide the graph. • When you graph an equation in the polar system, you plot r in terms of θ; i.e., r = f(θ). • Create an θ/r table, fixing θ values and computing corresponding r values. Then connect the dots. • You also use knowledge of the equation to guide the graph. • Example: r = 4 sin θ 0 −2 2 −4 4 −2 0 2 In this case, 0→π completed the graph; π →2π retraced it. 0
III. Sketching Polar Graphs • You can also use knowledge of the eqn to guide the graph: • Use Symmetry • r = f(sin θ) is symm wrt the line θ = π/2 • r = f(cosθ) is symm wrt the polar axis • Determine θ value(s) that produce max r values • Determine θ value(s) that produce zero r values • Previous example: r = 4 sin θ • Symm wrt the line θ = π/2 • Max when sin θ = 1, i.e., when θ = π/2; value is 4 • Zero when sin θ = 0, i.e., when θ = 0 or θ = π
III. Sketching Polar Graphs • Example: r = 1 – 2 cosθ • Symm wrt the polar axis • Max when cos θ = −1 or θ = π; value is 3 • Zero when cosθ = ½ or θ = π/3 −1 −.73 0 1 2 2.73 3 Plot points and connect; Then use symmetry to complete figure. →Limacon with inner loop.
Simple polar equations can produce beautiful graphs r = aθ Lemiscates Circles a a Archimedan Spiral Limacons: r = a ± b cos θ, r = a ± b sin θ, a > 0, b > 0 a a a r = a r2 = a2 cos 2θ r2 = a2 sin 2θ r = a cos θ r = a sin θ Cartoid: a/b = 1 Limacon w/ inner loop: a/b < 1 Dimpled Limacon: 1 < a/b < 2 Convex Limacon: a/b > 2 Rose Curves: n petals if n is odd; 2n petals if n is even (n ≥ 2) n = 5 n = 3 n = 6 n = 4 a : length of petals r = a sin nθ r = a cos nθ
III. Sketching Polar Graphs: Ti89 Graphing mode = polar. Must also be in radian mode. Let’s graph r = 5 sin 4θ. Press to draw the graph. Press to draw the graph. Press & changethe graph mode to 3:POLAR. Press Enter to Save. Enter Y=Editor. Press forthe variable, θ. Redraw using ZoomSqr. Set ZoomTrig. Confirm window by pressing
IV. Equation conversion (Polar ↔ Rectangular) • Sometimes a very simple polar equation is complex when converted to rectangular form (or vice-versa) • Conversion factors: • x = r cos θ y = r sin θ x2 + y2 = r2 • Rectangular to Polar y = f(x) → r = f(θ) or y2 → r2 • x2 + y2 = 9 2. 3. x2 + y2 – 2ay = 0 • Polar to Rectangular r = f(θ) → y = f(x) or r2 → y2 • r = 2 2. 3. r = sec θ • r = 4 sin θ 5. r = 2 cscθ