Download
1 / 47
470 likes | 607 Views
New Approaches to Scientific Computing. Geoffrey Fox gcf@indiana.edu www.infomall.org School of Informatics and Computing and Community Grids Laboratory, Digital Science Center Pervasive Technology Institute Indiana University. Presentation to visitors from Lilly

E N D
New Approaches to Scientific Computing Geoffrey Fox gcf@indiana.eduwww.infomall.org • School of Informatics and Computing • and Community Grids Laboratory, • Digital Science Center • Pervasive Technology Institute • Indiana University Presentation to visitors from Lilly September 25, 2009, Bloomington
PTI Activities in Digital Science Center • Community Grids Laboratory led by Fox • Gregor von Lazewski: FutureGrid architect • Marlon Pierce: Grids, Services, Portals including Chemistry and Polar Science applications • Judy Qiu: Multicore and Data Intensive Computing including Biology and Cheminformatics applications • Open Software Laboratory led by Andrew Lumsdaine • Software like MPI, Scientific Computing Environments • Parallel Graph Algorithms • Complex Networks and Systems led by Alex Vespignani • Very successful H1N1 spread simulations run on Big Red • Can be extended to other epidemics and to “critical infrastructure” simulations such as transportation
FutureGrid • September 10, 2009 Press Release • BLOOMINGTON, Ind. -- The future of scientific computing will be developed with the leadership of Indiana University and nine national and international partners as part of a $15 million project largely supported by a $10.1 million grant from the National Science Foundation (NSF). The award will be used to establish FutureGrid—one of only two experimental systems (other one is GPU enhanced cluster) in the NSF Track 2 program that funds the most powerful, next-generation scientific supercomputers in the nation. • http://uitspress.iu.edu/news/page/normal/11841.html
FutureGrid • FutureGrid is part of TeraGrid – NSF’s national network of supercomputers – and is aimed at providing a distributed testbed of ~9 clusters for both application and computer scientists exploring • Clouds • Grids • Multicore and architecture diversity • Testbed enabled by virtual machine technology including virtual network • Dedicated network connects allowing experiments to be isolated • Modest number of cores (5000) but will be relatively large as a Science Cloud
Add 768 core Windows Server at IU and Network Fault Generator
Indiana University is already part of base TeraGrid through Big Red and services
OSCAR Document Analysis InChI Generation/Search Computational Chemistry (Gamess, Jaguar etc.) Varuna.net Quantum Chemistry CICC Chemical Informatics and Cyberinfrastructure CollaboratoryWeb Service Infrastructure GTM and MDS Portal Services RSS Feeds User Profiles Collaboration as in Sakai Core Grid Services Service Registry Job Submission and Management Local Clusters IU Big Red, TeraGrid, Open Science Grid
Science Gateways in PTI • Science gateways provide Web user interfaces and Web services for accessing Grids and Clouds. • NSF TeraGrid, Amazon EC2, etc • Workflow and large scale job submission to Grids and Clouds. • Web 2.0 approaches to Web-based science. • JavaScript Grid APIs for building Gadgets and Mash-ups. • Open Social-based social networking gadgets • iGoogle style gadget containers
OGCE Workflow Tools Wrap and Execute Codes on the TeraGrid WRF-Static running on Tungsten
Various portal services deployed as portlets: Remote directory browsing, proxy management, and LoadLeveler queues.
Similar set of services deployed as Google Gadgets: MOAB dashboard, remote directory browser, and proxy management.
ORE-CHEM Project • Object Reuse and Exchange (ORE): simple semantic markup for describing distributed digital documents. • Atom/XML and RDF bindings • Multiple versions, formats, supplemental data, authors, citations, etc are all URIs in a master document. • ORE-CHEM project is Semantic web application applied to chemistry. • Link papers to experiments, computing runs. • Create searchable RDF triple stores of linked information.
IU’s ORE-CHEM Pipeline (Phase I) Harvest NIH PubChem for 3D Structures Convert Gaussian Output to CML Convert CML to RDF->ORE-Chem Convert PubChem XML to CML Submit Jobs to TeraGrid with Swarm Insert RDF into RDF Triple Store Goal is to create a public, searchable triple store populated with ORE-CHEM data on drug-like molecules. Convert PubChem XML to CML Convert CML to Gaussian Input Conversions are done with Jumbo/CML tools from Peter Murray Rust’s group at Cambridge. Swarm is a Web service capable of managing 10,000’s of jobs on the TeraGrid. We hope to use Dryad to manage this pipeline.
Data Intensive (Science) Applications • From 1980-200?, we largely looked at HPC for simulation; now we have data deluge • 1) Data starts on some disk/sensor/instrument • It needs to bedecomposed/partitioned; often partitioning natural from source of data • 2) One runs a filterof some sort extracting data of interest and (re)formatting it • Pleasingly parallel with often “millions” of jobs • Communication latencies can be many millisecondsand can involve disks • 3) Using same (or map to a new) decomposition, one runs a possibly parallel application that could require iterative steps between communicating processes or could be pleasing parallel • Communication latencies may be at most some microsecondsand involves shared memory orhigh speed networks • Workflow links 1) 2) 3) with multiple instances of 2) 3) • Pipeline or more complex graphs • Filters are “Maps” or “Reductions” in MapReduce language
MapReduce “File/Data Repository” Parallelism Instruments Map = (data parallel) computation reading and writing data Reduce = Collective/Consolidation phase e.g. forming multiple global sums as in histogram Communication via Messages/Files Portals/Users Map1 Map2 Map3 Reduce Disks Computers/Disks
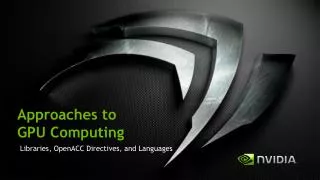
Cloud Computing: Infrastructure and Runtimes • Cloud infrastructure: outsourcing of servers, computing, data, file space, etc. • Handled through Web services that control virtual machine lifecycles. • Cloud runtimes:: tools (for using clouds) to do data-parallel computations. • Apache Hadoop, Google MapReduce, Microsoft Dryad, and others • Designed for information retrieval but are excellent for a wide range of science data analysis applications • Can also do much traditional parallel computing for data-mining if extended to support iterative operations • Not usually on Virtual Machines
Application Classes • In the past I discussed application—parallel software/hardware in terms of 5 “Application Architecture” Structures • 1) Synchronous – Lockstep Operation as in SIMD architectures • 2) Loosely Synchronous – Iterative Compute-Communication stages with independent compute (map) operations for each CPU. Heart of most MPI jobs • 3) Asynchronous – Compute Chess; Combinatorial Search often supported by dynamic threads • 4) Pleasingly Parallel – Each component independent – in 1988, I estimated at 20% total in hypercube conference • 5) Metaproblems– Coarse grain (asynchronous) combinations of classes 1)-4). The preserve of workflow. • Grids greatly increased work in classes 4) and 5) • The above largely described simulations and not data processing. Now we should admit the class which crosses classes 2) 4) 5) above • 6) MapReduce++ which describe file(database) to file(database) operations • 6a) Pleasing Parallel Map Only • 6b) Map followed by reductions • 6c) Iterative “Map followed by reductions” – Extension of Current Technologies that supports much linear algebra and datamining • Note overheads in 1) 2) 6c) go like Communication Time/Calculation Time and basic MapReduce pays file read/write costs while MPI is microseconds
Applications & Different Interconnection Patterns Input map iterations Input Input map map Output Pij reduce reduce Domain of MapReduce and Iterative Extensions MPI
Cluster Configurations DryadLINQ Hadoop / MPI DryadLINQ / MPI
Current Bio/Cheminformatics work • EST (Expressed Sequence Tag) sequence assembly program using DNA sequence assembly program software CAP3. • Metagenomics and Pairwise Alu gene alignment using Smith Waterman dissimilarity computations followed by MPI applications for Clustering and MDS (Multi Dimensional Scaling) • Correlating Childhood obesity with environmental factors by combining medical records with Geographical Information data with over 100 attributes using correlation computation, MDS and genetic algorithms for choosing optimal environmental factors. • Mapping the >20 million entries in PubChem into two or three dimensions to aid selection of related chemicals with convenient Google Earth like Browser. This uses either hierarchical MDS (which cannot be applied directly as O(N2)) or GTM (Generative Topographic Mapping).
CAP3 - DNA Sequence Assembly Program EST (Expressed Sequence Tag) corresponds to messenger RNAs (mRNAs) transcribed from the genes residing on chromosomes. Each individual EST sequence represents a fragment of mRNA, and the EST assembly aims to re-construct full-length mRNA sequences for each expressed gene. IQueryable<LineRecord> inputFiles=PartitionedTable.Get <LineRecord>(uri); IQueryable<OutputInfo> = inputFiles.Select(x=>ExecuteCAP3(x.line)); \DryadData\cap3\cap3data 10 0,344,CGB-K18-N01 1,344,CGB-K18-N01 … 9,344,CGB-K18-N01 Input files (FASTA) Cap3data.pf GCB-K18-N01 V V Cap3data.00000000 \\GCB-K18-N01\DryadData\cap3\cluster34442.fsa \\GCB-K18-N01\DryadData\cap3\cluster34443.fsa ... \\GCB-K18-N01\DryadData\cap3\cluster34467.fsa Output files Input files (FASTA) [1] X. Huang, A. Madan, “CAP3: A DNA Sequence Assembly Program,” Genome Research, vol. 9, no. 9, pp. 868-877, 1999.
High Energy Physics Data Analysis • Histogramming of events from a large (up to 1TB) data set • Data analysis requires ROOT framework (ROOT Interpreted Scripts) • Performance depends on disk access speeds • Hadoop implementation uses a shared parallel file system (Lustre) • ROOT scripts cannot access data from HDFS • On demand data movement has significant overhead • Dryad stores data in local disks • Better performance
Reduce Phase of Particle Physics “Find the Higgs” using Dryad • Combine Histograms produced by separate Root “Maps” (of event data to partial histograms) into a single Histogram delivered to Client
Kmeans Clustering • Iteratively refining operation • New maps/reducers/vertices in every iteration • File system based communication • Loop unrolling in DryadLINQ provide better performance • The overheads are extremely large compared to MPI Time for 20 iterations Large Overheads
Pairwise Distances – ALU Sequencing • Calculate pairwise distances for a collection of genes (used for clustering, MDS) • O(N^2) problem • “Doubly Data Parallel” at Dryad Stage • Performance close to MPI • Performed on 768 cores (Tempest Cluster) 125 million distances 4 hours & 46 minutes Processes work better than threads when used inside vertices 100% utilization vs. 70%
Dryad versus MPI for Smith Waterman Flat is perfect scaling
Dryad versus MPI for Smith Waterman Flat is perfect scaling
Alu and Sequencing Workflow • Data is a collection of N sequences – 100’s of characters long • These cannot be thought of as vectors because there are missing characters • “Multiple Sequence Alignment” (creating vectors of characters) doesn’t seem to work if N larger than O(100) • Can calculate N2 dissimilarities (distances) between sequences (all pairs) • Find families by clustering (much better methods than Kmeans). As no vectors, use vector free O(N2) methods • Map to 3D for visualization using Multidimensional Scaling MDS – also O(N2) • N = 50,000 runs in 10 hours (all above) on 768 cores • Our collaborators just gave us 170,000 sequences and want to look at 1.5 million – will develop new algorithms! • MapReduce++ will do all steps as MDS, Clustering just need MPI Broadcast/Reduce
Apply MDS to Patient Record Data and correlation to GIS properties MDS and Primary PCA Vector MDS of 635 Census Blocks with 97 Environmental Properties Shows expected Correlation with Principal Component – color varies from greenish to reddish as projection of leading eigenvector changes value Ten color bins used
MPI on Clouds: Matrix Multiplication Performance - 64 CPU cores Speedup – Fixed matrix size (5184x5184) • Implements Cannon’s Algorithm [1] • Exchange large messages • More susceptible to bandwidth than latency • At 81 MPI processes, at least 14% reduction in speedup is noticeable
MPI on Clouds Kmeans Clustering Performance – 128 CPU cores Overhead • Perform Kmeans clustering for up to 40 million 3D data points • Amount of communication depends only on the number of cluster centers • Amount of communication << Computation and the amount of data processed • At the highest granularity VMs show at least 3.5 times overhead compared to bare-metal • Extremely large overheads for smaller grain sizes
MPI on Clouds Parallel Wave Equation Solver Total Speedup – 30720 data points • Clear difference in performance and speedups between VMs and bare-metal • Very small messages (the message size in each MPI_Sendrecv() call is only 8 bytes) • More susceptible to latency • At 51200 data points, at least 40% decrease in performance is observed in VMs Performance - 64 CPU cores
PWDA Parallel Pairwise data clustering by Deterministic Annealing run on 24 core computer ParallelOverhead Intra-nodeMPI Inter-nodeMPI Threading Parallel Pattern (Thread X Process X Node)
Pairwise Clustering: 4 Clusters 35339 Points Parallel Overhead 0.46 hours 0.19 hours Threads x MPI Processes x Nodes
MG30000 Clustering by Deterministic Annealing MPI Parallel Overhead Thread Thread Thread Thread Thread Thread Parallelism MPI MPI
Conclusions • We looked at several applications with various computation, communication, and data access requirements • All DryadLINQ applications work, and in many cases perform better than Hadoop • We can definitely use DryadLINQ (and Hadoop) for scientific analyses • Coding is much simpler in DryadLINQ than Hadoop • A key issue is support of inhomogeneous data • Data deluge implies need for very large datamining applications requiring clouds and new technologies
High end Multi Dimension scaling MDS • Given dissimilarities D(i,j), find the best set of vectors xi in d (any number) dimensions minimizing i,j weight(i,j) (D(i,j) – |xi – xj|n)2 (*) • Weight chosen to refelect importance of point or perhaps a desire (Sammon’s method) to fit smaller distance more than larger ones • n is typically 1 (Euclidean distance) but 2 also useful • Normal approach is Expectation Maximation and we are exploring adding deterministic annealing to improve robustness • Currently mainly note (*) is “just” 2 and one can use very reliable nonlinear optimizers • We have good results with Levenberg–Marquardt approach to 2 solution (adding suitable multiple of unit matrix to nonlinear second derivative matrix). However EM also works well • We have some novel features • Fully parallel over unknowns xi • Allow “incremental use”; fixing MDS from a subset of data and adding new points • Allow general d, n and weight(i,j) • Can optimally align different versions of MDS (e.g. different choices of weight(i,j) to allow precise comparisons • Feeds directly to powerful Point Visualizer
Deterministic Annealing Clustering • Clustering methods like Kmeans very sensitive to false minima but some 20 years ago an EM (Expectation Maximization) method using annealing (deterministic NOT Monte Carlo) developed by Ken Rose (UCSB), Fox and others • Annealing is in distance resolution – Temperature T looks at distance scales of order T0.5. • Method automatically splits clusters where instability detected • Highly efficient parallel algorithm • Points are assigned probabilities for belonging to a particular cluster • Original work based in a vector space e.g. cluster has a vector as its center • Major advance 10 years ago in Germany showed how one could use vector free approach – just the distances D(i,j) at cost of O(N2) complexity. • We have extended this and implemented in threading and/or MPI • We will release this as a service later this year followed by vector version • Gene Sequence applications naturally fit vector free approach.
Key Features of our Approach • Initially we will make key capabilities available as services that we eventually be implemented on virtual clusters (clouds) to address very large problems • Basic Pairwise dissimilarity calculations • R (done already by us and others) • MDS in various forms • Vector and Pairwise Deterministic annealing clustering • Point viewer (Plotviz) either as download (to Windows!) or as a Web service • Note all our code written in C# (high performance managed code) and runs on Microsoft HPCS 2008 (with Dryad extensions)
Canonical Correlation Choose vectors a and b such that the random variables U = aT.Xand V = bT.Ymaximize the correlation = cor(aT.X,bT.Y). X Environmental Data Y Patient Data Use R to calculate = 0.76