Download
1 / 28
290 likes | 499 Views
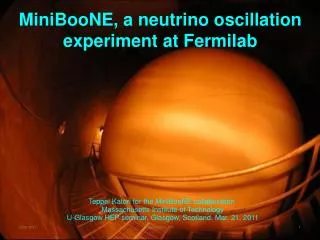
Models of the 5-Minute Oscillation & their Excitation. Bob Stein – Michigan State U. What did we know about the solar oscillations way back then?. Broad, featureless spectrum with maximum ~ 300 s. Period of maximum decreases with increasing height in the atmosphere

E N D
Models of the 5-MinuteOscillation & their Excitation Bob Stein – Michigan State U.
What did we know about the solar oscillations way back then? • Broad, featureless spectrum with maximum ~ 300 s. • Period of maximum decreases with increasing height in the atmosphere • Oscillations are standing waves: • Intensity leads velocity by ~ 90o • Waves are in phase over range of heights
V-I phaseFe 5576Lites & Chipman 1979At low frequency: in phase = intensity of granules;At high frequency: in phase = propagating acoustic waves;At 5 min (ω~0.02): I leads V by ~ 90o
The Models • Ringing of Atmosphere at Cutoff Frequency • Resonant Eigenmodes
Cutoff Frequency Singularity • For vertical, isothermal waves driven by pressure fluctuations (due to granules) the solution for the displacement is (Noyes 63) Where the wave vector is So waves near the cutoff frequency,υc ~ 300 s, will be preferentially ampified.Also: Kato 1966, Souffrin 1966, 1970, Moore 1974
Linear Filtering Wave amplitude grows exponentially, but at non-propagating frequencies the amplitude is damped Noyes, 1963; Souffrin, 1966
Pulse wake Vgroup -> 0 at υ->υc Higher frequency waves run ahead, Leave behind oscillating standing wakeat υ=υc Stix1970
Resonant Cavities 3 layer model: Tmin = 4300 Chromosphere=104 Corona or Interior=106 Acoustic waves trapped between cool photosphere and hot corona (or interior), (region IIa), or in cool layer between 2 hot layers in Tmin region for ω>ωac (region Ia). Gravity waves trapped in cool layer (NBV large) between 2 hot layers (NBV small) (region Ig), or between hot and cold layers (region Iig). Only region Iia, acoustic waves trapped below photosphere or in corona match observed oscillation frequency and horizontal wave number.
Resonant Eigenmodes Cavity: the chromosphere • Bottom = cool photosphere (high cutoff frequency, steep density gradient) = rigid boundary • Top = transition region (steep temperature, density gradient) = free boundary • Bahng & Schwarzschild 1963Meyer & Schmidt 1966Uchida 1965, 1967Stein & Leibacher 1969McKenzie 1971
Structure in the Spectrum In 1968 Frazier observed some structure in the spectrum & it was possible to quantify the cavity:
Cavity: Photosphere • Non-divergent, surface gravity waves (f-mode) ω=√gk. Boundary conditions: chromosphere-corona transition region is free surface, interior has increasing scale height H (temperture). (Jones 1969) • Trapped internal gravity waves (Uchida 1967, Ulmschneider 1968)
Cavity Interior: Roger Ulrich 1970Leibacher & Stein 1971Top Boundary: cool photosphere with low cutoff frequencyBottom Boundary: high temperature interior refracts waves back toward surface
Modes: k-Ω – Roger Ulrich Frazier 68 observations Tanenbaum et al. 69 observations
Modes of piecewise linear temperature atmosphere Leibacher, thesis 1971
Toy Model • Resonance condition: • Dispersion relation: • Atmosphere:
Low l modes i.e. s=ω/kH
High l Modes i.e. S=ω/kH
Mode Excitation • Convective Excitation(earliest idea) • Granule pumping • Lighthill Mechanism • Overstability • Κ-mechanism • Thermal overstability • Stochastic excitation by convective turbulence • Reynolds stresses • entropy fluctuations
Granule Pumping • Overpressure in granule produces sound waves
Lighthill Mechanism • Rate of acoustic energy generation isturbulent energy density ÷ turbulence time scale × efficiency factor • In absence of external forces (gravity) turbulent eddies are incompressible and isotropic, so emission is quadrupole • In stratified medium also have monopole & dipole emission • Lighthill 1952; Moore & Spiegel 1964; Unno 1964; Stein 1967; Musielak 1994
Thermal Overstability Mechanism: instability which drives system away from equilibrium. Restoring force that brings system back to equilibrium. Process that reduces the driving force or increases the restoring force. Acoustic wave is compressed as it moves downward into hotter surroundings, so it gets heated and its pressure increases which makes it expand more. Spiegel 1964; Moore & Spiegel 1966; Ulrich 1970; Chitre & Gokhale 1975; Jones 1976; Graff 1976
Kappa Mechanism • Compression increases temperature -> opacity • Radiation gets trapped -> heats gas • Pressure increases -> greater expansion • Expansion decreases temperature -> opacity • Radiation escapes -> cools gas • Pressure decreases -> greater compression Ando & Osaki 1975; Goldreich & Keeley 1977; Christensen-Dalsgaard & Frandsen 1983; Balmforth & Gough 1990; Balmforth 1992 Conclusion: p-modes are likely stable
Stochastic Excitation • Convective Reynolds Stress & Entropy Fluctuations can drive acoustic waves • Lighthill formulation does not work inside source region, needs generalizing to include mode properties. • Can be expressed as PdV work by non-adiabatic pressure fluctuations on mode compressibility. Goldreich & Keeley 1977; Goldreich & Kumar 1990; Balmforth 1992; Goldreich, Murray & Kumar 1994; Nordlund & Stein 2001; Stein & Nordlund 2001; Samadi & Goupil 2001; Stein et al. 2004; Chaplin et al. 2005; +
Modified Lighthill Mechanism • Replace arbitrary displacement in the inhomogeneous wave equation with the oscillation eigenmode displacement. Balmforth 1992; Goldreich, Murray & Kumar 1994; Samadi& Goupil 2001; Chaplin et al. 2005
PdV Work The PdV work is so the work integral is This can be evaluated to obtain the rate of mode excitation The mode energy Eω is and the non-adiabatic pressure fluctuations are This is similar to the results of Balmforth 1992, Samadi et al. 1993 & Goldreich, Murray & Kumar 1994 except that neglect the phase between the pressure fluctuations and the mode compression by taking the square of each independently. Usually these formulae for mode excitation are evaluated using simple models of convection. However, they can be evaluated exactly using results of convection simulations.
Hinode simulation