Download
1 / 27
270 likes | 366 Views
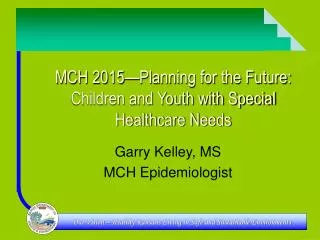
Planning for the Future: Children and Youth with Special Health Care Needs (CYSHCN). Presented by Garry Kelley, Ms MCH Epidemiologist. CYSHCN Demographics. Age Group. Percent of Kansas Children with Disability. Gender.

E N D
Planning for the Future:Children and Youth with Special Health Care Needs (CYSHCN) Presented by Garry Kelley, Ms MCH Epidemiologist
CYSHCN Demographics Age Group Percent of Kansas Children with Disability Gender HRSA. 2005/06 National Survey of Children with Special Health Care Needs. Data Resource Center.
CYSHCN Race/Ethnicity HRSA. 2005/06 National Survey of Children with Special Health Care Needs. Data Resource Center.
National Outcome Measures 1 • Percent of CYSHCN whose families are partners in the decision making at all levels and who are satisfied with the services they receive HRSA. 2005/06 National Survey of Children with Special Health Care Needs. Data Resource Center. HRSA. 20007 National Survey of Child Health. Data Resource Center.
National Outcome Measures 1b Percent of CYSHCN (0-5 years) who visit a doctor and was not asked about parental concerns. HRSA. 2005/06 National Survey of Children with Special Health Care Needs. Data Resource Center. HRSA. 20007 National Survey of Child Health. Data Resource Center.
National Outcome Measures 2 • Percent of CYSHCN who receive coordinated, ongoing, comprehensive care within a medical home HRSA. 2005/06 National Survey of Children with Special Health Care Needs. Data Resource Center.
National Outcome Measures 3 • Percent of CYSHCN who adequate private and/or public insurance to pay for the services they need HRSA. 2005/06 National Survey of Children with Special Health Care Needs. Data Resource Center.
National Outcome Measures 3b • Percent of CYSHCN who have at least one unmet need HRSA. 2005/06 National Survey of Children with Special Health Care Needs. Data Resource Center.
National Outcome Measures 4 • Percent of CYSHCN who are screened early and continuously for special health services HRSA. 2005/06 National Survey of Children with Special Health Care Needs. Data Resource Center.
National Outcome Measures 5 • Percent of CYSHCN whose families report the community-based service systems are organized so they can use them easily HRSA. 2005/06 National Survey of Children with Special Health Care Needs. Data Resource Center.
National Outcome Measures 6 • Percent of youth with special health care needs who receive the services necessary to make appropriate transitions to adult health care, work, and independence HRSA. 2005/06 National Survey of Children with Special Health Care Needs. Data Resource Center.
Transitions • Percent of disabled (18-34) who attended college U.S. Census. American Community Survey 2006-2007.
Transitions 2 • Percent of disabled (16-34) who are employed U.S. Census. American Community Survey 2006-2007.
Overall Health • Percent of youth with special health care needs whose overall health is excellent or very good HRSA. 2007 National Survey of Child Health. Data Resource Center.
Oral Health • Percent of youth with special health care needs whose overall oral health is excellent or very good HRSA. 2007 National Survey of Child Health. Data Resource Center.
Condition Impact Health • Percent of youth with special health care needs whose health conditions are moderate or severe HRSA. 2007 National Survey of Child Health. Data Resource Center.
Condition Impact Health 2 • Percent of youth with special health care needs whose conditions consistently or greatly affect their daily activities HRSA. 2007 National Survey of Child Health. Data Resource Center.
Physical Fitness • Percent of youth with special health who engage in rigorous physical activity at least 3 times a week HRSA. 2007 National Survey of Child Health. Data Resource Center.
Physical Fitness 2 • Percent of youth with special health who are overweight or obese HRSA. 2007 National Survey of Child Health. Data Resource Center.
Child Care 1 • Percent of children with special health needs aged 0-5 years whose parents made different child care arrangements in past month or made employment-related changes due to child care reasons in the past year. HRSA. 2007 National Survey of Child Health. Data Resource Center.
Child Care 2 • Percent of children with special health needs aged 6-11 years who spent some amount of time alone without adult supervision in the past week HRSA. 2007 National Survey of Child Health. Data Resource Center.
Employment • Percent of children with special health needs whose families experienced financial problems due to child's health needs. HRSA. 2007 National Survey of Child Health. Data Resource Center.
Employment 2 Percent of children with special health needs whose health needs caused family members to cut back or stop working HRSA. 2007 National Survey of Child Health. Data Resource Center.
Parents • Percent of children with special health needs whose parents are often angry, annoyed, or frustrated towards their child HRSA. 2007 National Survey of Child Health. Data Resource Center.
School • Percent of children with special health needs who are always engaged at school HRSA. 2007 National Survey of Child Health. Data Resource Center.
School 2 • Percent of children with special health needs who repeated at least 1 grade since Kindergarten HRSA. 2007 National Survey of Child Health. Data Resource Center.