Download

1 / 9
90 likes | 179 Views
Detailed analysis of NICMOS images for supernova study, including data inventory, calibration, photometry techniques, and fitting results.

E N D
1 NICMOS Analysis of ACS04-076 • Data Inventory • Calibration • Bad pixel mask • Extracting photometry • Next steps
J-band Date Images 4/16 F8010 5/11 F9010 5/23 Fa010, fa020, fa030 H-band Date Images 4/16 F8020, f8030 5/5 F6010, f6020 5/17 F7010, f7020, f7030 2 Data Inventory
3 Calibration • Process the data with: • Vitaliy's version of calnica • It does everything that the standard calnica does (dark subtraction, flatfielding, etc.) and in addition features an improved cosmic rejection algorithm • Pedsky for sky and pedestal subtraction • Drizzling (or mosaicing with calnicb) is only used for cross-checks Pipeline-processed data Custrom-processed data
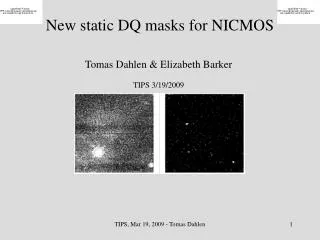
4 Bad pixel mask • Using Vitaliy's ROOT-based software that finds outliers (the pixels that are consistently – over many images – too high or too low). • For this purpose, I've used ~20 files from the HST data archives, covering the month of April.
5 Photometry • Because the supernova is dim, located on the outskirts of a galaxy, and because the quality of NICMOS images is low, aperture photometry will not produce good results • So, try PSF photometry with Vitaliy's ROOT-based software. • Use TinyTim v6.3 for PSF modeling • Simple linear (in x and y) model for the background for now • Account for sky errors • Perform a fit for the SN flux, position, and the background parameters “Tiny Tim” PSF in F110W
6 J-band results • For now, only have J-band points • There appear to be problems with some fits – no reason to go on with H-band until they are sorted out • Here, N/A means the fit didn't converge
7 Fit residuals Bad fit (5/11 #1) Good fit (4/16 #1)
8 VERY PRELIMINARY lightcurve! If you trust these very preliminary results in a single band (which you shouldn't), this SN appears to be more consistent with z ~ 1.4.
9 Next steps • Understand why the fit fails on a few points. • Perhaps the problem is inaccurate initial estimate of the SN position on late epoch images – perhaps using SHIFTFIND will help • A quick check using shifts from the header shows that the initial estimates are reasonable, however • Refine the background model • Run the fitter on combined (drizzled) images, check for consistency