Download

1 / 31
310 likes | 442 Views
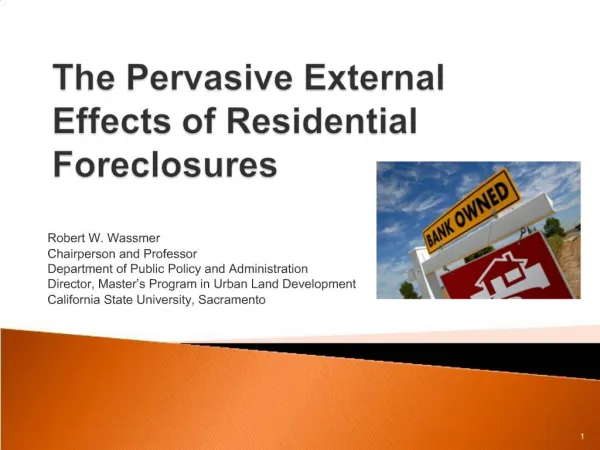
The Pervasive External Effects of Residential Foreclosures. Robert W. Wassmer Chairperson and Professor Department of Public Policy and Administration Director, Master’s Program in Urban Land Development California State University, Sacramento. Outline. Background Theory to Policy Analysis

E N D
The Pervasive External Effects of Residential Foreclosures Robert W. Wassmer Chairperson and Professor Department of Public Policy and Administration Director, Master’s Program in Urban Land Development California State University, Sacramento
Outline • Background • Theory to Policy Analysis • Previous Research • Empirical Method • Data • Findings • Policy Implications
Background • My interest • Timely, Teaching, and ICPSR (Inter-University Consortium for Political and Social Research) • Five stages of residential mortgage loan distress • (1)Mortgage default – fail to make a scheduled loan payment • (2)LisPendens(suit pending) – possible to file legal intent to reclaim the property after three consecutive months of default • (3)Negotiation – Short sale or restructured loan • (4)Foreclosure sale – Property sold to the highest bidder (minimum to cover loan balance and fees) or original lender takes possession • (5)REO – If original lender takes possession then classified as Real Estate Owned (bank owns property and mortgage no longer exists) • Only this distinction noted in my home sales data
Background Highest Growth in Foreclosure Filings (Stage 2) 2006 Qtr 3 to 2007 Qtr 3 Sacramento 162% Phoenix 66% Source: “From the Subprime to the Exotic: Excessive Mortgage Market Risk and Foreclosures,” Journal of the American Planning Association, Winter 2008.
Background Drastic Rise in California “Distressed” Home Sales (Stage 3+) 2003-06: < 5% 2009, Q1: > 45% Source: “The Impact of Distressed Sales on Repeat-Transaction House Price Indexes,” Federal Housing Finance Agency, May 27, 2009, http://www.fhfa.gov/webfiles/2916/researchpaper_distress%5B1%5D.pdf
Background 2009 Quarter 3, Housing Units Per Foreclosure Filing (Step 2) Source: http://nationalmortgageprofessional.com
Background Phoenix Area August 2009 Red - % REO Sales Blue - % Pre-Foreclosure and Short Sales Phoenix About 60% REO About 15% Pre-Foreclosure Source: http://phoenixwaterfronttalk.com
Background • “The quickest way to end up underwater is to live in a neighborhood that’s plagued by foreclosures. As homes go into foreclosure, they create a domino effect, lowering home values throughout a neighborhood in a cascade beyond homeowner’s control.” • Smart Money, August 17, 2009 • “As the foreclosure crisis continues to worsen, the contagion is spreading. You cannot just say those foreclosures are hurting someone else.” • Ellen Schloemer, Executive Vice President, Center for Responsible Lending, quoted in New York Times, June 14, 2009 • “But by making these investments in foreclosure prevention today, we will save ourselves the costs of foreclosure tomorrow – costs that are borne not just by families with troubled loans, but by their neighbors and communities and by our economy as a whole.” • President Obama, February 18, 2009 speech at Mesa Arizona’s Dobson High School introducing his Making Home Affordable Plan
Theory to Policy Analysis • Possible external effects of a “distressed” sale • (1) Blight – failure to maintain and/or upgrade resulting in increased neighborhood vandalism and/or crime • (2) Valuation –properties sold at a discount and reduce appraisals of neighborhood properties • (3) Supply – increased supply of available homes and thereby neighborhood prices reduced • Policy implications • An additional external benefit to consider when weighing taxpayer/consumer cost of publicly funded foreclosure prevention • Does a neighborhood effect exist? • How “wide” is the neighborhood effect? • Of what value is the neighborhood effect?
Empirical Method • Standard hedonic OLS regression model • Ln(pi) = α + β1Fi + β2Hi + β3Si + β4Vi + β5Ni + β6di + β7Ti + β8Pi + εi • Where • p = sales price • F = vector of foreclosure characteristics • H = vector of house size characteristics • S = vector of house structural characteristics • V = vector of house vintage characteristics • N = vector of neighborhood characteristics • d = time allowed for sale • T = vector of time dummies • P = vector of place dummies • ε = independent and identically distributed (iid) error term
Empirical Model • Variable specifics • F = (REO Dummy, Tenth Mile REOs Quarter, Quarter Mile REOs Quarter, One Mile REOs Quarter, Fraction Zip REO Quarter) • H = (Home SQ Feet 1000s, Lot SQ Feet 1000s) • S = (One Story Dummy, No Garage Dummy, No Fireplace Dummy, Bedrooms, Full Baths, Half Baths, Septic/Sewer Dummy, Wood Ext Dummy, Brick Ext Dummy, Lap Ext Dummy, Vinyl Ext Dummy, Tile Roof Dummy, Metal Roof Dummy, Slate Roof Dummy, Shake Roof Dummy, Contemporary Dummy, Mediterranean Dummy, Victorian Dummy) • Excludes Stucco Ext Dummy and Ranch Dummy • V = (Years Old, Years Old Squared, Years Since Remodeled) • N = (Horse Property Dummy, Community Service District Dummy, Covenant Restriction Dummy, Association Dummy, Association Dues) • d = (Days on Market 100s) • T = (Quarter Two Dummy, Quarter Three Dummy, Quarter Four Dummy, Quarter Five Dummy, Quarter Six Dummy) • Excludes Quarter One Dummy • P = (60 Zip Code Dummies) • Excludes City of Davis central zip code
Empirical Model • Independent and identically distributed error term? • Regression error term exhibit constant variance? • Not likely (heteroskedsatic) • Causes biased standard errors • Likely related to size of house • Greater variance in smaller square foot houses • Corrected with weighted least squares (White’s) • Observations of the error uncorrelated with each other? • Not likely (spatial autocorrelation) • Causes biased standard errors • Inflates R-squared • Tobler’s 1st Law of Geography • Everything is related to everything else, but near things are more related than distant
Empirical Model • GEODA and GEODASpace to test/correct for spatial autocorrelation • GEODA Center, Director Luc Anselin, @ ASU • First geocoded addresses in ARCMAP • Not contiguous, but points in space • Specify related neighbors by distance or K nearest • Here I use K nearest (tried 1, 2, 4, 6, 8, 10, and 12) • Calculate spatial weight matrixes for each • Evaluate similarity of observations for neighbors • Through Moran’s I Statistic calculated for dependent variable • Range -1 to +1 • K=1, MI=0.85; K=2, MI=0.84; K=4, MI=0.82; K=6, MI=0.81; K=9, MI=0.81, K=10, MI=0.80; K=12, MI=0.79 • Positive spatial autocorrelation • High sales value correlate with neighbor’s high sales value • Estimate using spatial error model (K=1) in GEODASpace • Beta version • Also allows for heteroskedasticity correction • “Choked” on too much data • Bug to be worked out • Going to try R or STATA Programa
Data • 35,822 Sac Area single-family home sales • MLS data • Six counties • El Dorado, Nevada, Placer, Sacramento (73.3%), Yolo, and Yuba • 61 zip codes • 6 quarters • Jan-March 2008 Quarter One (10.2%) • April-June 2008 Quarter Two (18.5%) • July-Sept 2008 Quarter Three (21.8%) • Oct-Dec 2008 Quarter Four (17.5%) • Jan-March 2009 Quarter Five (16.0%) • April-June 2009 Quarter Six (16.0%)
Data Distribution of 35,822 Home Sales
Data Sacramento may see more foreclosures in 2010 than this year. "Clearly, foreclosures will be up next year versus 2009," a top Bank of America staffer said in a call with reporters this week. "I think 2009 was somewhat of an artificially low number because of (foreclosure) moratoriums," said Jack Schakett, head of credit loss prevention. Sacramento Bee, p. 1B, December 18, 2009
Findings • Confirmed • Own REO Effect • Real Estate Owned Home • -14.56% • REO Neighborhood Effects • Additional REO in quarter within three-different bands • Tenth Mile: -0.61%; Quarter Mile: -0.19%; One Mile: -0.03% • New • REO Zip Code Effect • All homes sold in zip code in quarter are REOs • -4.22%
Policy Implications • Private and public costs of bank foreclosures • Regression results offers the opportunity to quantify • Information asymmetry in residential mortgage process often given as reason for govt intervention • Second reason (negative external effects) further justifies govt intervention • Dollar impact of REOs on Non-REO home prices yields upper limit of cost of govt intervention (paid by all) to reduce REOs • Even if your home is not under threat of becoming real estate owned, you may want to support a government program that costs less than the upper limit due to external effect
Policy Implications • Market value of 36,822 homes sold between January 2008 and June 2009 in 61 Sacramento Area zip codes • Total : $9,078,443,375 ($9.0784 B) • Real Estate Owned: $4,525,437,212 ($4.5254 B) • Not Real Estate Owned: $4,553,006,163 ($4.5530 B) • Found that these values are lower due to own and external effects of real estate owned sales • Own effect (-14.56%) • $4.5254 B * -0.1456 = -$658.9 M
Policy Implications • External effects of REOs on REOs ($1.0206 B) • (1) Fraction Zip REO (-4.22%) • $4.5254 B * (0.6125 * -0.0422) = -$117.0 M • (2) Tenth Mile REOs (-0.61%) • $4.5254 B * (8.78 * -0.0061) = -$242.4 M • (3) Quarter Mile REOs (-0.19%) • $4.5254 B * (27.41 * -0.0019) = -$235.7 M • (4) One Mile REOs (-0.03%) • $4.5254 B * (313.44 * -0.0003) = -$425.5 M • External effects of REOs on Non-REOs ($1.0268 B) • (1) Fraction Zip REO (-4.22%) • $4.5530 B * (0.6125 * -0.0422) = -$117.7 M • (2) Tenth Mile REOs (-0.61%) • $4.5530 B * (8.78 * -0.0061) = -$243.9 M • (3) Quarter Mile REOs (-0.19%) • $4.5530 B * (27.41 * -0.0019) = -$237.1 M • (4) One Mile REOs (-0.03%) • $4.5530 B * (313.44 * -0.0003) = -$428.1 M
Policy Implications The Cost of 18 Months of Foreclosure Activity to Sacramento Area Home Sales* * Total cost of $2.7063 B on a total sales base of $9.0784 B, or 29.8% REO costs to Non-REOs of $1.0268 B on a total sales base of $9.0784 B, or 11.31%
Policy Implications • Actual negative external effect is even greater • Calculated $1.03 B decrease in sales price to Non-REO home sellers leaves out • Unrealized loss in home values to those that did not sell • Imposes credit restrictions • Loss in yearly local property tax revenue from lower acquisition assessment value of -$2.7063 B * 0.01 = -$27.1 M
Policy Implications • What can be done to slow foreclosure sales among existing owners? • Mortgage modification • Temporary or permanent (preferred) • More short sales • Allow qualified buyer to assume an “non-assumable” loan • Surrender property and forgive debt • Future owners? • Greater regulation of sub-prime mortgage lending • Greater regulation of high-risk prime mortgage lending • Community Reinvestment Act Regulations altered • Credit to bank for refinancing a predatory loan • Credit to bank for more responsible mortgage lending practices • Reconsider previous housing policy push encouraging ownership for all • Reduce external effects once foreclosed? • Sell the foreclosed property sooner
Policy Implications • Policies in place • Federal • FHA Hope for Homeowners Program (Oct. 2008 – Sept. 2011) • With restrictions, allow refinance into FHA backed affordable mortgages ($300 B in backing) • Little used due to required lender immediate write down of principal and borrower sharing half of later gains • Treasury Making Home Affordable Plan (April 2008 - ) • For Freddie Mac and Fannie Mae owned and backed: (1) Refinance mortgage loans, through the Home Affordable Refinance Program, and (2) modify mortgage loans, through the Home Affordable Modification Program ($200 B in backing) • Expect to be used by 3 to 4 million homeowners • Only 110,000 as of Dec. 2009
Policy Implications • State • California • Foreclosure Prevention Act • First of kind in nation • Lender must wait 90 days after LP recorded before they can publish notice of sale (valid through Dec. 2010) • Greater time to work out a loan modification • But allows for exemption if bank has own loan modification program • Arizona • SB 1271 Anti-Deficiency Statute • If foreclosure on home lived in less than 6 months, owner liable for the difference between the foreclosure sale price and the original loan • Does this encourage or discourage foreclosure? • Passed July 2009 and repealed in Nov. 2009 (but court case pending unconstitutional due to passage in budget bill) • AZ Legislature will take issue up in this session
Policy Implications • Suggested policy • Mandatory Mediation in the Foreclosure Process • Center for American Progress (June 2009) • Possible 9 million U.S. homeowners may lose home by 2014 • 1/8 current mortgages delinquent or in foreclosure • Prime loans account for most new foreclosures • More than 80% of at risk homeowners have not discussed situation with lender • Suggest federal requirement that mortgage holder and lender meet in structured mediation process at least once after LP filed and before foreclosure sale • Evidence of success in Philadelphia and Connecticut *http://www.americanprogress.org/issues/2009/06/time_we_talked.html