Download
1 / 1
10 likes | 181 Views
G.Migliori(1,2,3), P.Grandi(2), G.C.G.Palumbo(1), G.Brunetti(4), C.Stanghellini(4) (1) Bologna University, Bologna, Italy, (2) INAF/IASF Bologna, Italy (3) S.I.S.S.A./I.S.A.S., Trieste, Italy (4) INAF/IRA Bologna, Italy. Abstract.

E N D
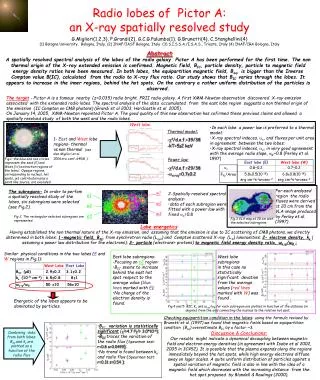
G.Migliori(1,2,3), P.Grandi(2), G.C.G.Palumbo(1), G.Brunetti(4), C.Stanghellini(4) (1) Bologna University, Bologna, Italy, (2) INAF/IASF Bologna, Italy (3) S.I.S.S.A./I.S.A.S., Trieste, Italy (4) INAF/IRA Bologna, Italy Abstract A spatially resolved spectral analysis of the lobes of the radio galaxy Pictor A has been performed for the first time. The non thermal origin of the X-ray extended emission is confirmed. Magnetic field, BIC, particle density, particle to magnetic field energy density ratios have been measured. In both lobes, the equipartition magnetic field, Beq, is bigger than the Inverse Compton value B(IC), calculated from the radio to X-ray flux ratio. Our study shows that BIC varies through the lobes. It appears to increase in the inner regions, behind the hot spots. On the contrary a rather uniform distribution of the particles is observed. Radio lobes of Pictor A: an X-ray spatially resolved study The target - Pictor A is a famous nearby (z=0.035) radio bright FRII radio galaxy. A first XMM-Newton observation discovered X-ray emission associated with the extended radio lobes. The spectral analysis of the data accumulated from the east lobe region suggests a non thermal origin of the emission (IC Compton on CMB photons) (Grandi et al 2003, Hardcastle et al. 2005). On January 14, 2005, XMM-Newton repointed Pictor A. The good quality of this new observation has cofirmed these previous claims and allowed a spatially resolved study of both the west and the radio lobes. West lobe: • In each lobe a power law is preferred to a thermal model; • X-ray spectral indeces, x, and fluxes per unit area in agreement between the two lobes; • X-ray spectral indeces, x, in very good agreement with the average radio slope, R~0.8 (Perley et al. 1997) Thermal model: 1- East and West lobe regions- thermal vs.non thermal (see also Migliori et al. 2006xru..conf..645M): -2/d.o.f.=39/38 -kT=5±2 keV Fig.1: the blue and red circles represent the east (E) and West (W) extraction regions of the lobes. Opaque regions, corresponding to nucleus, hot spots, jet contribution plus a point like source, are excluded Power law: -2/d.o.f.=29/38 -x-ray=0.7±0.2 For each analyzed region the radio fluxes were derived at 20 cm from the VLA image produced by Perley et al. (1997) The subregions- In order to perfom a spatially resolved study of the lobes, six subregions were selected (see Fig.2). w1 w2 w3 • 2-Spatially resolved spectral analysis: • data of each subregion were fitted with a power law with fixed x=0.8 e1 e2 e3 Fig 2. The rectangular selected subregionsare represented. Fig.3 VLA map at 20 cm with the selected subregions. Lobe energetics: Having established the non thermal nature of the X-ray emission, and assuming that the emission is due to IC scattering of CMB photons, we directly determined in both lobes: 1-magnetic field, BIC, from synchrotron radio (Lsyn) and Compton scattered X-ray (LX) luminosities; 2- electron density, ke ( assuming a power law distribution for the electrons); 3- particle (electrons+ protons) to magnetic field energy density ratio, ωe+p/ωB : Similar physical conditions in the two lobes (E and W regions in Fig.1): • East lobe subregions: • -Focusing on e2 region: • BIC seems to increase behind the east hot spot respect to the average value (blue lines marked with E); • No change of the electron density is found. West lobe subregions: in this case no statistically significant devation from the average values (red lines marked with W) was found . Energetic of the lobes appears to be dominated by particles. Fig.4 and 5: BIC, Ke and ωe+p/ωB for each subregion are plotted in function of the distance (in degree) from the axis connecting the nucleus to the relative hot spot. Checking equipartition condition in the lobes: using the formula revised by Brunetti et al. (1997) we found that magnetic fields based on equipartition condition (Beq) overestimate BIC by a factor ~3. • BIC variation is statistically significant (2=4.7 P2= 3.0*10-4); • BICtraces the variation of the radio flux (Spearman test:r=0.8 s=0.0499); • No trend is found between ke and radio flux (Spearman test: r=0.31 s=0.54 ); Combining data from both lobes: BIC and ke are plotted as a function of the radio flux Discussion & Conclusions: Our results might indicate a dynamical decoupling between magnetic field and electron energy densities (in agreement with Isobe et al 2002, 2005 in 3C452). It is possible that the plasma expands along the regions immediately beyond the hot spots, while high energy electrons diffuse away on lager scales. A quite uniform distribution of particles against a spatial variation of magnetic field is also in line with the idea of a magnetic field which decreases with the increasing distance from the hot spot proposed by Blundell & Rawlings (2000).