Download
1 / 24
240 likes | 479 Views
Experimental Investigation of Polarization Impact on 60 GHz WLAN Systems. Date: 2009-05-11. Authors:. Alexander Maltsev, Intel Corp. Abstract. This contribution presents results of the experimental investigation of polarization impact on 60 GHz WLAN systems. . Alexander Maltsev, Intel Corp.

E N D
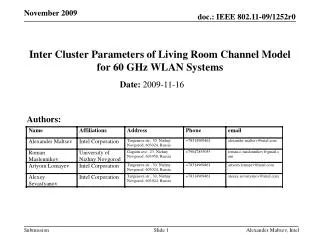
Experimental Investigation of Polarization Impact on 60 GHz WLAN Systems Date: 2009-05-11 Authors: Alexander Maltsev, Intel Corp. Alexander Maltsev, Intel Corp.
Abstract This contribution presents results of the experimental investigation of polarization impact on 60 GHz WLAN systems. Alexander Maltsev, Intel Corp. Alexander Maltsev, Intel Corp.
Introduction • The polarization characteristics are important to consider for 60 GHz WLAN channel modeling in TGad [1]. • The impact of polarization is significantly different for 60 GHz frequency band than for lower frequency bands of 2.4 GHz and 5 GHz, used by legacy WLAN systems. • This report presents experimental results on polarization impact on 60 GHz WLAN system. Alexander Maltsev, Intel Corp. Alexander Maltsev, Intel Corp.
Scenario of Experimental Investigation • Several sets of measurements were carried out in a small office conference room with dimensions equal approximately to 3 m x 4.5 m x 3 m (W x L x H). The measurements were done in the same conference room that was used to obtain experimental results presented in [2]. • The transmit and receive antennas with their RF components were placed on tripods at the height of 1 m above the floor corresponding to approximately 20 cm above the level of the table. • Different transmit and receive antenna positions around the table in the conference room were tested. • Measurements were performed for different combinations of transmit and receive antennas polarizations Alexander Maltsev, Intel Corp. Alexander Maltsev, Intel Corp.
Example of Measurement Scenario Alexander Maltsev, Intel Corp. Alexander Maltsev, Intel Corp.
Measurement Setup • Prototype equipment is the same as used to perform measurements described in [2] • To control the polarization of the TX and RX antenna systems a set of waveguide components was used. • Four different types of antenna polarizations could be set • linear horizontal polarization • linear vertical polarization • left-hand circular polarization • right-hand circular polarization Alexander Maltsev, Intel Corp. Alexander Maltsev, Intel Corp.
TX Antenna System Used for Experimental Measurements Alexander Maltsev, Intel Corp.
RX Antenna System Used for Experimental Measurements Alexander Maltsev, Intel Corp.
Data Collection • For the measurement setup placement shown in Slide 5 received power was obtained as a function of receive and transmit angles measured relative to the LOS direction. • The received power was measured relative to the noise level in the baseband giving the signal-to-noise ratio (SNR) characteristics. Alexander Maltsev, Intel Corp. Alexander Maltsev, Intel Corp.
Data Collection, cont’d • SNR distribution functions were measured for five different configurations of the transmitter and receiver antennas polarizations: • TX – left-hand circular polarization (LHCP) – RX – left-hand circular polarization (LHCP) (polarizations matched in LOS environment); • TX – left-hand circular polarization (LHCP) – RX – right-hand circular polarization (RHCP) (orthogonal polarizations in LOS environment); • TX – left-hand circular polarization (LHCP) – RX – horizontal linear polarization (HLP) (3 dB loss in LOS environment due to polarizations mismatching); • TX – horizontal linear polarization (HLP) – RX – vertical linear polarization (VLP) (orthogonal polarizations in LOS environment); • TX – horizontal linear polarization (HLP) – RX – horizontal linear polarization (HLP) (polarizations matched in LOS environment); Alexander Maltsev, Intel Corp.
Illustrated Example of Measurement Results • The next five slides illustrate measured SNR distributions for one measurement TX-RX location in the conference room. • For this example the elevation angles for both transmit and receive antennas were equal to 00 (i.e. antennas were steered in horizontal plane). • A plot is shown for each of the polarization combinations previously listed. • Clusters in TX and RX azimuth are identified in terms of the number of reflections. Alexander Maltsev, Intel Corp.
Co-polarized TX and RX antennas achieves maximum gain (~30 dB) with LOS path (“A” clusters) First order reflected clusters (“B” and “C” clusters) are degraded because of the circular polarization handedness change upon reflection With the second order reflections (clusters “D” and “E”) the handedness of the circular polarization changes twice and so LHCP-LHCP provides near-optimal performance Distribution of the received signal power for TX circular left – RX circular left polarizations of antennas C E A B D Alexander Maltsev, Intel Corp. Alexander Maltsev, Intel Corp.
Received power level for LOS case (“A” clusters) is defined by the cross-polarization discrimination (XPD) of the antenna in our case was about 18-20 dB First order reflected clusters (“B” and “C” clusters) in LHCP-RHCP configuration provides near-optimal performance because of the circular polarization handedness change upon reflection LHCP-RHCP configuration has 2.3 dB (“C” cluster) and 5.6 dB (“B” cluster) better SNR than for LHCP-LHCP configuration Distribution of the received signal power for TX circular left – RX circular right polarizations of antennas C E A B D Alexander Maltsev, Intel Corp. Alexander Maltsev, Intel Corp.
Co-polarized TX and RX antennas achieves maximum gain (~30 dB) with LOS path (“A” clusters) Linear horizontal polarization orientation is parallel to the plane of incidence and so the orientation of first order reflected clusters (“B” and “C” clusters) does not change after the reflection HLP-HLP configuration is rather effective for first order reflections (16.5 dB SNR for “B” cluster and 12.4 dB for “C” cluster) Such configuration requires similar spatial orientation of the TX and RX antennas that may not always be achieved in a practical system HLP-HLP provides near-optimal performance for second order reflections (clusters “D” and “E”) Distribution of the received signal power for TX horizontal – RX horizontal polarizations of antennas C E A B D Alexander Maltsev, Intel Corp. Alexander Maltsev, Intel Corp.
Received power level for LOS case (“A” clusters) is defined by the cross-polarization discrimination (XPD) of the antenna in our case was about 18-20 dB In a practical system (portable devices), linear polarized TX and RX antennas may oriented with orthogonal polarization In this case the degradation of first order reflected (“B” and “C”) clusters will be 12-16 dB relative to the matched polarizations Distribution of the received signal power for TX horizontal – RX vertical polarizations of antennas C E A B D Alexander Maltsev, Intel Corp. Alexander Maltsev, Intel Corp.
The LOS power (“A” clusters 28.8 dB) ) for the LHCP-HLP antennas polarizations configuration should be 3 dB less relative to the co-polarized configurations measured difference was about 2 dB probably due to non-ideality of the circular polarization of the polarizer LHCP-HLP is also a robust configuration for single (“B” and “C”) and double ( “D” and “E”) reflected clusters Distribution of the received signal power for TX circular left – RX horizontal polarizations of antennas C E A B D Alexander Maltsev, Intel Corp. Alexander Maltsev, Intel Corp.
Received SNR for different types of clusters and different TX and RX antennas polarizations - Summary from Slides 12-16 Alexander Maltsev, Intel Corp. Alexander Maltsev, Intel Corp.
Discussion of Measurement Results Different antenna polarization configurations provide maximum SNR for different types of clusters To achieve maximum efficiency for all types of clusters the system should be able to adaptively change polarization characteristics of antennas at TX and RX sides Alternatively, the most robust non-adaptive (fixed) configuration providing moderate (2-3 dB) degradation (relative to the case of matched polarizations) for all clusters is the configuration using linear polarization at one antenna and the circular polarization at the other antenna. May 2009 Slide 18 Alexander Maltsev, Intel Corp. Alexander Maltsev, Intel Corp.
Complete Set of Experimental Measurements • Measurements were taken at six additional locations in the same conference room for all “visible” clusters • As before, the same five different combination of TX and RX antenna polarization configurations were used • Data analysis was performed as follows • All clusters were identified and SNR values were calculated for all conference room locations and TX/RX polarization combinations • For each conference room location, the TX/RX polarization combination that provided the maximum SNR was identified • Degradation of other configurations relative to the maximum one was calculated • Cumulative distribution function (CDFs) was calculated for each TX/RX polarization combination over all the clusters and conference room locations Alexander Maltsev, Intel Corp.
For each cluster the polarization configuration was identified that provides the maximum received power. Degradation for other polarization configurations was calculated relatively to this maximum power. CDFs were obtained for all different polarization configurations Least degradation with linear co-polarized antennas Maximum degradation of only 5 dB However, largest degradation when the TX/RX polarization is misaligned resulting in linear cross-polarization May 2009 Statistical Results Slide 20 Alexander Maltsev, Intel Corp. Alexander Maltsev, Intel Corp.
Average degradation of different antenna configurations for different types of clusters • Polarization mismatch degradation depends on the signal cluster type. • To illustrate this dependence the average degradation for every polarization combination and different types of clusters (LOS, first order reflected and second order reflected) is presented in the table below. • Circular and liner polarized antennas provides the most robust configuration. * - these values are underestimated because many clusters were not identified in the measurements for this configuration (received power was below the noise level) and in these cases the SNR was taken equal to 0 dB. The real SNR is negative that would make the degradation even larger. Alexander Maltsev, Intel Corp. Alexander Maltsev, Intel Corp.
Discussion of Experimental Results • Linear co-polarized antennas provide on average the maximum received power, with a degradation of less than 5 dB. • However, for this configuration polarization vectors of the TX and RX antennas must be parallel to each other, difficult to guarantee in a practical system • Circular co-polarized antennas do not have any restrictions on the orientation of the antenna polarization vectors and have good performance for LOS and second-order reflected clusters. • However, for first order reflected clusters the relative degradation is 5.7 dB which is quite significant. • Circular cross-polarized antennas are effective for first order reflections but are not effective for LOS and second order reflections. • Cross-polarized linear antennas have large relative loss and such configuration is not appropriate for a communication system. • The most robust case is when one end of the communication link uses circular polarization and the other of the communication link uses linear polarization. • In this case the relative degradation is within 2-3 dB for all types of clusters. Alexander Maltsev, Intel Corp.
Conclusion • The measurement data demonstrated that mismatch of polarization characteristics of transmit and receive antennas can result in large degradations of the received signal power by 10-20 dB. • Polarization characteristics are very important for 60 GHz WLAN systems and need to be properly addressed in the channel model and during the system design stage. • Mitigation of the impact of polarization may require dedicated support in the standard for 60 GHz WLAN system. Alexander Maltsev, Intel Corp. Alexander Maltsev, Intel Corp.
References • V. Erceg et al, “TGad Channel Model Requirements”, IEEE doc. 802.11-09/0323r1, Mar. 2009. • A. Maltsev et al, “60 GHz WLAN Experimental Investigations”, IEEE doc. 802.11-08/1044r0, Sept. 2008. Alexander Maltsev, Intel Corp. Alexander Maltsev, Intel Corp.