Download
1 / 14
140 likes | 159 Views
This article explores the key drivers towards the future of the electric grid, including changing supply mix, expanding transmission, and increasing system flexibility needs. It also discusses the applications and impacts of Smart Grid Investment Grants in the United States, as well as the challenges and lessons learned from the Smart Grid Demonstration Projects.

E N D
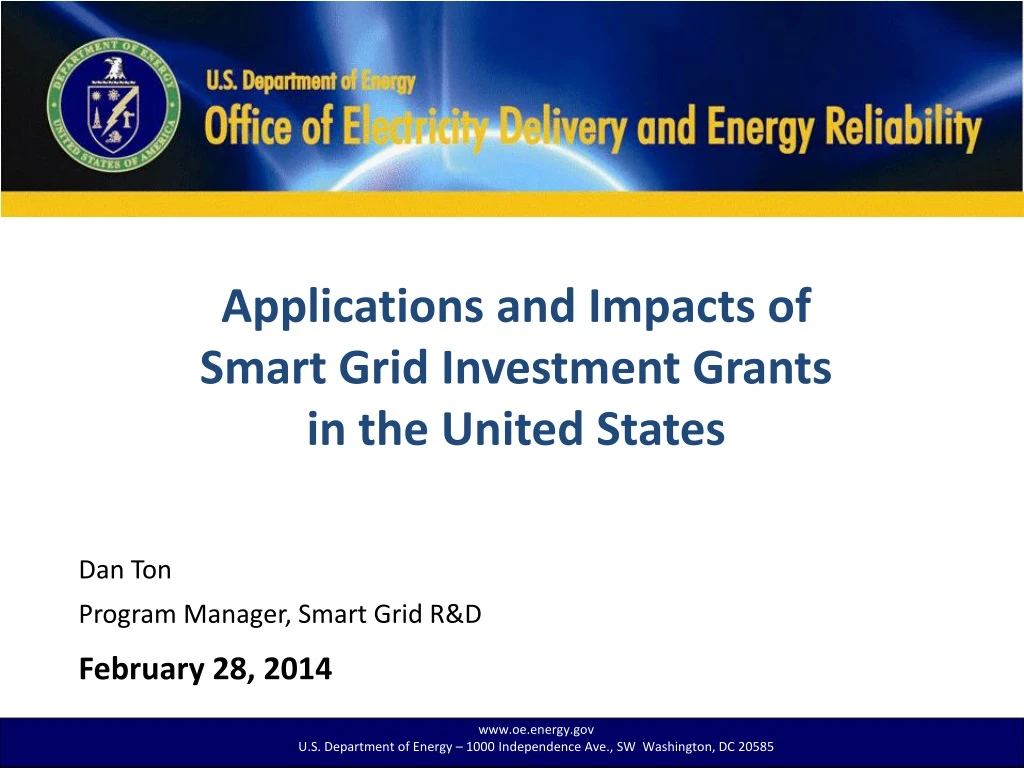
Applications and Impacts of Smart Grid Investment Grants in the United States Dan Ton Program Manager, Smart Grid R&D February 28, 2014
Key Drivers toward the Future of the Electric Grid 2009 2035 • 51% coal • 19% nuclear • 20% natural gas • 3% oil • 6% hydro • 1% other renewable • Changing Supply Mix • Expanding transmission • Increasing system flexibility needs • More natural gas • More renewables • Same or less coal • Same or less nuclear • Same or less oil • 3653 billion kWh • Hybrids, No PEVs • Electrically-sensitive equipment (limited consideration – PQ) • Demand Transformation • Expanding digital economy • Demand-side management • Demand growth • More than 5000 billion kWh • Load curves – increased peaking • PEVs (could increase demand 25%) • More electrically sensitive equipment (2.5x) • 140 control areas • Energy management systems (<1%) • 180,000 miles of wires • ~10 million DG units • Complexity of Grid • Expanding footprint • Overlay of markets • Operating “closer to the edge” • Nodes within control area increase 5-10x • Energy management systems (70%) • Additional 30,000 miles needed • ~ 22 million DG units (2.5x increase) • Blackouts • Aging infrastructure • Vulnerability of assets • Vulnerability of Energy Infrastructure • Interdependencies of electric and energy systems • Communications & controls • Infrastructure protection • Increased globalization • Materials and resource limitations • All-hazard risks will continue to increase 2
Recovery Act Grid Modernization Programs Recovery Act Grid Modernization Programs • Smart Grid Investment Grants (SGIG)* • $3.4 billion • Smart Grid Regional Demonstrations (SGDP)* • $620 million • Workforce Training • $100 million • Interconnection-wide Transmission Planning and Resource Analysis • $80 million • Interoperability Standards (with NIST) • $12 million • Other • Technical Assistance to States on Electricity Policy ($44 million) • Local Energy Assurance Planning ($10 million) • One-time Appropriation $4.5B of Recovery Act Funds Resource Assessment & Transmission Planning Resource Assessment & Transmission Planning Smart Grid Interoperability Standards Smart Grid Interoperability Standards Other Other Workforce Training Workforce Training Smart Grid Demos Smart Grid Demos Investment Grants *Originally authorized by the Energy Infrastructure Security Act 2007, EISA 1306 and EISA 1304 3
Grid Modernization Investments SGIG projects accelerate industry investment to achieve a modern grid $7.9 billion with cost share to be spent through 2015 ARRA Spending EPRI Estimate $338 - $476 billion needed through 2030 EPRI. Estimating the costs and benefits of the smart grid: A preliminary estimate of the investment requirements and the resultant benefits of a fully functioning smart grid. EPRI, Palo Alto, CA; 2011. Brattle Group Estimate $880 billion needed through 2030 Chupka, M.W. Earle, R., Fox-Penner, P., Hledik, R. Transforming America’s power industry: The investment challenge 2010 – 2030. Edison Electric Institute, Washington D.C.,: 2008. 4
SGIG – 99 Projects Funded at $7.9 Billion (includes public and private investments) 5
Lessons Learned from SGIG Deployments • Local- and state-level decisions primarily affect investments in smart grid technology, especially decisions affecting consumers • Ex: The adoption of synchrophasor technology will depend on decisions at regional (ISO) levels • “We have never done this before” • Interoperability, systems integration, and cyber security issues are all new • Intense interest to share experiences, lessons learned, and best practices throughout the industry • Every utility is at a different starting point • Value proposition of smart grid technology is still under review • Costs vs. benefits are not well-defined • Necessary to illustrate business case to all stakeholders – regulators, utilities, policy makers, etc. • Cybersecurity plans encourage creation or expansion of cybersecurity policies and best practices, especially in smaller organizations with fewer resources • Rigorous cybersecurity reviews reveal where restructuring and organization-wide policies and practices could promote a stronger culture of security 7
Smart Grid Demonstration Projects:The Portfolio Regional Demonstration Projects (16): Quantify smart grid cost-effectiveness and verify technologies at a scale that can be readily replicated across the country. By improving the balance between generation and load, these projects demonstrate power quality and reliability improvements via frequency and voltage regulation, dynamic line ratings, Volt Ampere Reactive (VAR) control, and distribution automation. Energy Storage Projects (16): Advanced battery systems (including flow batteries), ultra-capacitors, flywheels and compressed air energy systems. Voltage monitoring and regulation for large-scale wind and photovoltaic (PV) systems integrated with the grid, congestion relief, and system regulation. Program Duration: 02/01/2010–09/30/2015 Program Value: $1,647,933,112 8
Smart Grid Costs and Benefits Smart grid benefit-to-cost ratios, from a low 1.5:1 for Reference Case to a high 2.6:1 for Ideal Case, according to industry report Smart Grids Costs and Benefits by Capability Reference Case Ideal Case *Includes remote disconnect and reconnect benefits Ref: Smart Grid Economic and Environmental Benefits, SGCC, October 2013 9
Economic Impact of Smart Grid Investments Smart Grid ARRA Support’s Impact on Economic Output As of March 2012, $2.96 billion invested in Smart Grid projects generated at least $6.8 billion in total economic output, with a GDP multiplier of 2.5-2.6 higher than other government investment opportunities Percentages may not equal 100% due to rounding Comparison of GDP Multipliers Ref: Economic Impact of Recovery Act Investments in the Smart Grid, USDOE, April 2013 10
Path Forward • Apply relationships with the utility industry (developed through the ARRA efforts) to share results, examine policies, and develop R&D strategies (roadmaps) • Continue efforts to capture the business case for smart grid technology • Focus R&D efforts • Demonstrations of integrated systems • Tool/model/application development for both planning and operations in the distribution and transmission arenas • Cybersecurity and interoperability advancement • Data management and visualization • Continue to support consumer behavior studies through pilot projects and technical assistance • Support efforts to leverage communications infrastructures to enable networked community systems 11
International Smart Grid Drivers The primary drivers for Smart Grid differ regionally. Based on an international survey of the Energy Industry, the following table summarizes regional responses to key drivers for opportunities to implement smart grid technologies. ESTA International, October 2010
Opportune Time • The current state of Smart Grid developments and plans around the globe provides an opportunity to expand programs and technologies worldwide. • U.S. strategies and lessons learned through the Recovery Act and Grid Modernization programs will help the realization of cleaner, more reliable, and more efficient energy production and usage globally.
Thank you! Dan T. Ton Program Manager, Smart Grid R&D Office of Electricity Delivery and Energy Reliability U.S. Department of Energy (202) 586-4618Dan.ton@hq.doe.gov 14