Download
1 / 19
200 likes | 330 Views
Learn about adopting NOAA Atlas 14 for updated rainfall distributions, steps to develop them, and comparison with NRCS standards. Explore future directions in software development and GIS integration for precise modeling.

E N D
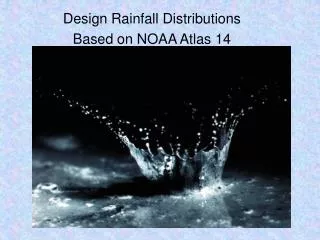
Design Rainfall Distributions Based on NOAA Atlas 14
General Considerations • Standard NRCS rainfall distributions were developed between 1960 and 1985. • NRCS is adopting NOAA Atlas 14 in the states where it is applicable. • Will a new set of rainfall distributions be required ? • If so, how to develop and apply them ? March 2009
Standard Rainfall Distributions March 2009
Geographic Application March 2009
Steps in developing a distribution • Determine ratios of x hour / 24 hour rainfall. • Place the rainfall ratio for the shortest duration in the center of the distribution. • Symmetrically place each larger duration to include the shorter durations. March 2009
0.7 6 hr Example of a Nested Distribution 0.6 3 hr March 2009
NOAA Atlas 14 web site • Download rainfall frequency data at: • http://hdsc.nws.noaa.gov/ March 2009
Select State March 2009
Selected Ohio March 2009
Selected Columbus Ohio March 2009
NOAA 14 Rainfall Ratios March 2009
Symmetrical Distribution March 2009
Compare to Type II March 2009
Where Type II and Type III compare with NOAA-derived distribution, 25-yr rainfall • Purple: Type II • Pink: Type III • Green: both March 2009
Points used to represent Maryland Counties March 2009
Future Directions Develop software to easily use the data. • Use GIS data layers to derive site-specific rainfall data for hydrologic modeling. March 2009