Download
1 / 57
570 likes | 698 Views
Climate on Geologic Time Scales & The CO 2 -Climate Connection. Where We’ve Been & Where We Will Go. Reviewed what processes control CO 2 greenhouse effect over geologic time (i.e., geochem. C cycle).

E N D
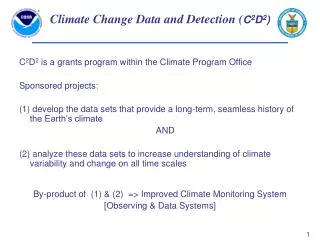
Climate on Geologic Time Scales & The CO2-Climate Connection
Where We’ve Been & Where We Will Go • Reviewed what processes control CO2 greenhouse effect over geologic time (i.e., geochem. C cycle). • And what negative feedbacks (e.g., T-weathering, CO2-weathering) might keep climate system from reaching &/or remaining in extreme states (e.g., Venus). • But data (geologic evidence) to support the theory (strong control of climate by CO2) is lacking*. • Now turn to geologic evidence for CO2-climate link during last 500 Myr. * Prior to ~550 Ma the lack of animals with hard skeletons and vascular plants to date has resulted in little or no fossil evidence of atmospheric CO2 levels.
Atmospheric CO2 During the Phanerozoic (540-0 Ma) Low (CO2+S) = Glaciation? Crowley (2000)
Permo-Carboniferrous Glaciations (~300-275 Ma) Stanley (2000)
Phanerozoic CO2 Evolution Permo-Carboniferous Glaciations Followed a period of marked CO2 decline • The CO2 decline likely resulted from the spread of rooted vascular plants in the Devonian, 400-360 Ma. • Dissolution of bedrock (weathering) from: secreted acids, metabolic CO2 from Corg decomposition, & anchoring of clay-rich soil to rock (which retains water). Stanley (2000)
Corg burial rate estimated from d13C in CaCO3 Atmospheric O2 estimated from Corg burial rate Stanley (2000)
Low CO2 during Permo-Carboniferous Glaciations Resulted from Massive Burial of Corg
High Corg Burial Results in High 13C/12C in Seawater & CaCO3 Stanley (2000)
20°-60° Warmer at Poles!2°-6° Warmer at EquatorDecreased Equator-to-Pole Temperature Gradient Kump et al. (1999)
Photosynthetic fractionation of carbon isotopes depends on [CO2]aq The Rubisco enzymatic photosynthesis pathway can be limited by available free CO2 within a cell. It seems that many photosynthetic algae uptake carbon by the diffusion of CO2 across the cell wall. When CO2 is abundant, this process results in a carbon isotope difference of ~30‰; it only uses a part of the available cellular CO2 and shows maximal isotopic fractionation. In the limit of extremely scarce aqueous CO2, the C fixation rate is diffusion limited, and the isotopic composition of the carbon entering the cell is the same as the aqueous dissolved CO2 (i.e., ~ -7‰). So as aqueous CO2 becomes more limiting, the isotopic composition of organic matter is shifted to more positive values.
Paleo pCO2 Estimates from Carbon Isotopic Fractionation by Algae Royer et al. (2001)
Fossil leaf cuticles provide evidence for elevated CO2 during Mesozoic SI(%)=SD/(SD+ED)*100% SD= stomatal density ED=epidermal cell density (i.e., the proportion of epidermal cells that are stomata
Calibrating the Leaf Stomatal “Paleo-barometer”Extrapolation to high pCO2 not established by calibration data…
Response of stomata to [CO2] is species-dependentLimiting SI-derived paleo-CO2 estimates to times and places when fossilized leaves from extant species exist…
Nevertheless, calibrations of the SI appear accurate for at least the last 9 kyr Royer et al. (2001)
Permo-Carboniferous Glaciations Geologic Evidence for a CO2-Climate Connection: Case Studies Mesozoic Warmth Cenozoic Cooling Adapted from Kump et al (1999)
Boron Isotopes in Seawater Also Indicate Large Cenozoic CO2 Decline d11B= [(11B/10B)smpl/ (11B/10B)std-1] x 1000‰ • B in seawater: B(OH)3, B(OH)4- • Relative abundance controlled by pH • B incorporated into calcite: B(OH)4- • Strong isotopic fractionation between 10B & 11B: • 10B = tetrahedral coordination, -19.8‰ relative to 11B in Zachos et al. (2001)
?Declining Seafloor Spreading Rates 80-40 Ma? Declining seafloor spreading rates are consistent with decreasing CO2 in early Cenozoic (more continental area to weather as sea-level fall, less subducted CaCO3 recycling)
But sea-level and sea-floor spreading rates in the past are uncertain…
? Link to Himalayan Orogeny & Uplift of Tibetan Plateau?(Raymo et al.)
Raymo et al. suggest that Increasing Strontium Isotopic Composition of Seawater During Cenozoic Implies Increasing Weathering Rates: SW 87Sr/86Sr is balance between: Deep-sea hydrothermal input of non-radiogenic Sr (0.7035) More radiogenic input riverine flux from continental weathering (0.712) Abyssal carbonate 87Sr/86Sr 87Rb-->87Sr, t1/2~48 Gyr DePaolo & Ingram (1985) in Edmond (1992)
Strontium Isotope Systematics (Crust) (Mantle) World Average River 87Sr/86Sr ~ 0.711 Ganges-Brahmaputra 87Sr/86Sr ~ 0.8 Albarede, F; Michard, A; Minster, J F; Michard, G (1981) Earth Planet. Sci. Lett. 55:229-236
Co-Variation of 87Sr/86Sr & CO2 through the Phanerozoic p~toc =d13CCaCO3-d13Corg p~ pCO2 High weathering &/or Low magmatism High CO2 • Weathering & magmatism may control CO2, but does CO2 control climate? Rothman (2002) PNAS, Vol 99(7):4167
CO2 During the last 450 kyr from the Vostok, Antarctica Ice Core Petit et al (1999) in Kump (2002) Nature, 419:188-190.
What caused glacial-interglacial CO2 variations?(a still-unanswered question!) • One Possible Scenario for Lower Glacial CO2: The Martin Hypothesis • Increased: • Equator-Pole T gradient, Wind strength, Dust flux to ocean, Iron flux to ocean • 50% of global 1° production occurs in ocean • Ocean 1° production is limited by iron (in major regions) • Higher 1° production draws CO2 out of atmosphere & • sequesters it in the deep ocean & sediments • Colder seawater dissolves more CO2
While a large and growing body of evidence indicates that CO2 and climate co-vary, there is some indication that the two may not be closely linked at all times….(& we all know that correlation does not require causation)
Intervals of high CO2 Model-Data SST Comparison Tropical SST anomaly (Data) -Assumes 2‰ of 3-5‰ d18O range due to ice volume (2x present ice volume in “icehouse”; No ice in “greenhouse”). -Leaves ~2‰, or ~9°C of SST change Simple E Balance Model -CO2 (Berner, 1992) -Solar constant increasing by 5% over Phanerozoic Ts-DTg=Teff sTeff4=S/4*(1-A) (or diagenetic alteration of CaCO3?)
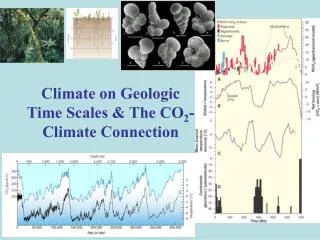
CO2 & Climate Records of change. (A) Comparison of CO2 concentrations from the GEOCARB III model (6) with a compilation (9) of proxy-CO2 evidence (vertical bars). Dashed lines: estimates of uncertainty in the geochemical model values (6). Solid line: conjectured extension to the late Neoproterozoic (about 590 to 600 Ma). RCO2, ratio of CO2 levels with respect to the present (300 parts per million). Other carbon cycle models (21, 22) for the past 150 million years are in general agreement with the results from this model. (B) Radiative forcing for CO2 calculated from (23) and corrected for changing luminosity (24) after adjusting for an assumed 30% planetary albedo. Deep-sea oxygen isotope data over the past 100 Ma (13, 14) have been scaled to global temperature variations according to (7). (C) Oxygen isotope-based low-latitude paleotemperatures from (5). (D) Glaciological data for continental-scale ice sheets modified from (7, 8) and based on many sources. The duration of the late Neoproterozoic glaciation is a subject of considerable debate. Diagenesis? Salinity? Ice Volume? Veizer et al. (2000) Crowley & Berner (2002) Science, Vol. 292:870.
Other Evidence for Weak CO2 - Climate Connection during Phanerozoic p~ pCO2 p~ toc =d13CCaCO3-d13Corg Cold intervals Royer et al. (2001) Rothman (2002) PNAS
But different CO2 proxies lead to different results…. Soil carbonate d13C & geochemical model toc=d13CCaCO3-d13Corg Rothman (2002)
Did a Gas Hydrate Release of Methane (2600 Gt) caused Late Paleocene Thermal Maximum? Benthic foraminifera from Atlantic & Pacific Zachos et al. (2001) • CO2 not the only greenhouse gas we need to consider when evaluating warm episodes.
Substantial evidence exists for a link between CO2 & climate on a variety of timescales….With some notable exceptions!Additional paleoclimate reconstructions & numerical model simulations are necessary. But the biggest (non-controlled) experiment ever attempted is now underway…
200 km crater • 10-km impactor • 65 Myr BP • Extinction of 75% of all species! Chicxulub CraterGulf of Mexico
200 km crater • 10-km impactor • 65 Myr BP • Extinction of 75% of all species! Chicxulub CraterGulf of Mexico