Download
1 / 45
450 likes | 574 Views
Food Insecurity through a fiscal lens. Jose Cuesta PRMPR April 22, 2011. Outline. “Fiscal Lens”: Work Program Food Security and Agricultural Spending in Bolivia Vulnerability index Agricultural Spending The Analysis Findings and Conclusions

E N D
Food Insecurity through a fiscal lens Jose Cuesta PRMPR April 22, 2011
Outline • “Fiscal Lens”: Work Program • Food Security and Agricultural Spending in Bolivia • Vulnerability index • Agricultural Spending • The Analysis • Findings and Conclusions • A Peek into Tariff Reform and Nutrition in Cote d’Ivoire
Work Program • How public use of resources affect distributional outcomes? • How fiscal policies affect welfare distribution • How inequality affects policy decisions • 3 pillars of work: • How traditional tools/techniques can deal with “non traditional sectors” • Regional disparities and public spending/revenue • Policy decisions during the crisis
Work on food security • “Non traditional” sector, regional perspective • Other examples are: • Nutritional effects of tariffs in Cote d’Ivoire • Unequal access to justice in Indonesia • Benefit incidence of road investments in Thailand • Central vs. local spending/revenue in Indonesia • Bolivia study is part of an Agricultural PER • How agricultural spending affects vulnerability to food insecurity in Bolivia?
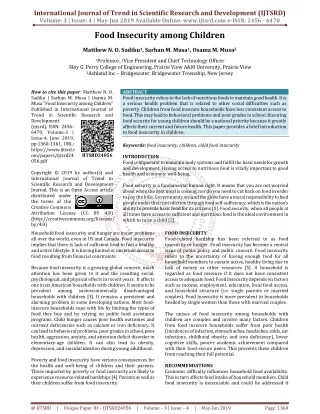
Food Insecurity and Public Agricultural Spending in Bolivia Policy Research Working Paper 5604 http://siteresources.worldbank.org/INTPOVERTY/Resources/WPS5604.pdf Jose Cuesta, Svetlana Edmeades & Lucia Madrigal
A simple story of success Agricultural spending by administrative level
Food Security Definition in Bolivia • Based on “access to nutritious food” definition, that is: “all people, at all times, have physical and economic access to sufficient, safe and nutritious food to meet their dietary needs, and food preferences for an active and healthy life” • Bolivia follows this international definition around four dimensions: • Food availability • Access to food • Stable access to food • Safe use of food • Definition of Vulnerability to Food also follows WFP’s VAM approach: • Risk exposure (e.g. natural disaster) • Capacity to address food insecurity (e.g., incomes, access to basic services) • Current situation as part of a historical trend (e.g. past malnutrition and poverty)
Food Security Policy in Bolivia • 2006 National Development Plan sets FS and sovereignty as objectives of national production • 2007 Agricultural Sector Strategy (Revolucion Rural, Agropecuaria y Forestal): • food security and sovereignty; • Increasing agricultural and forest production; and • sustainable management of natural resources • Food Security Interventions (INE monitoring plan) • land redistribution; • promotion of food production and exports by state-owned enterprises • food security programs, including support to communities & small producers • nutritional programs (children, women) and school meals, among others.
FS Programs and Projects 1. National Plan for Land Titling 2. National Plan for Land Distribution and Human Settlements 3. Planting the Right for Food (SEMBRAR) 4. Creation of Rural Food Initiatives (CRIAR) 5. Organized Enterprises for Development (EMPODERAR) 6. Renewal of the Role of the State in Rural Food Businesses (RECREAR) 7. Development of territorial, integration and cross-sectoral production complexes 8. National Plan for Coca Development 9. Sustainable Use of Natural Resources (SUSTENTAR) 10. Conservation of Nature and Environmental Quality (CONSERVAR) 11. Food Security Support Program (PASA) 12. Multisectoral Program of Zero Malnutrition 13. School Breakfast and Lunch Program Source: Adapted from MVI Social (2010).
From definition to measurement of vulnerability • Dependency rate • Life expectancy • Agricultural potential (4 values on soil capacity) • Forestry potential (5 values) • Road density • Draught frequency • Frost days per year • Low weight at birth • Per capita household food expenditures • Urbanization rate • Rural population density (and sq) • Prop. Institutionally attended births • Schooling years • Log of per capita consumption • Under five malnutrition rate • Altitude • Rainfall • Flood Propensity (categorical 4 values)
From measurement to analysis • VAM (Municipal Vulnerability Index) • 1=very low, 2=low, 3=moderate, 4=high, 5=very high vulnerability • For 2003 each municipality is assigned a value 1 to 5 according to “agreed” vulnerability based on background study on vulnerability of 15 agro-ecological regions in the country (socioeconomic, demographic, ethnic and gender equity, climatic risks, subjective ability to respond to risks) • MNL of VAM2003 on 20 variables • MNL estimates allow 5 probabilities for VAMi=1…5 for each municipality • Estimated MNL on 10 variables for 2006 and 2007 (only those statistically significant in 2003) • Largest estimated prob(VAM=i) determines assigned VAM to each municipality
Some analytical caveats A few obvious Not so obvious Inputs for and outcomes of FS (e.g., malnutrition, urbanization) Assumed same structural model between 2003 and 2007 (despite policies) Little wiggle room for IV • Original VAM 2003 • Pragmatic selection of variables based on data considerations (availability and frequency)… too far? • Interdependence: • Rural pop density and urbanization • Low birth weight and institutional delivery • Floods, rainfall, draught
A simple story of success… really? Agricultural spending by administrative level
Simple perhaps, but not uniform Per Capita Agricultural Spending by Department (constant 2005 prices) Figure 1. Vulnerability Status by Department
and not so simple Distribution of Restricted Agricultural Spending • Btw 15-20% of municipalities changed status • For 1 that worsens, 3 improve • Substantive annual variations in investments
Empirical strategy • Probit of VAM ( high ,low ) on pc capita agr spending • Several categories of spending considered • Restricted vs. Extended • Current vs. Investment • Research & Extension; Infrastructure; Support & Development; Administrative • Regional dummies and region-clustered errors • Single out level of spending from increases in spending • Combine contemporaneous and lagged levels (not many IV candidates) • Robustness checks: • 2006 data; • ordered probit; • total rather pc spending; • Controls: CAPACITY, ELECTORAL. SOCIAL SPENDING variables
Findings Positive impact of agr sp on high vam Restricted significant Investment drives results Infrastructure significant, also R&D Region specific effects
Findings Positive impact of agr sp on high vam Restricted, significant Investment drives results Infrastructure significant, also R&D Region specific effects
Findings Positive impact of agr sp on high vam Restricted, significant Investment drives results Infrastructure significant, also R&D Region specific effects
Findings Positive impact of agr sp on high vam Restricted, significant Investment drives results Infrastructure significant, also R&D Region specific effects
Findings Positive impact of agr sp on high vam Restricted significant Investment drives results Infrastructure significant, also R&D Region specific effects
Findings Positive impact of agr sp on high vam Restricted signficant Investment drives results Infrastructure significant, also R&D Region specific effects
Findings As before, positive impact of agr sp on high vam Now both Restricted and Extended are significant Investment keeps driving results Infrastructure significant and so R&E (now negative!) Region specific effects as before
Findings As before, positive impact of agr sp on high vam Now both Restricted and Extended are significant Investment keeps driving results Infrastructure significant and so R&E (now negative!) Region specific effects as before
Findings As before, positive impact of agr sp on high vam Now both Restricted and Extended are significant Investment keeps driving results Infrastructure significant and so R&E (now negative!) Region specific effects as before
Findings As before, positive impact of agr sp on high vam Now both Restricted and Extended are significant Investment keeps driving results Infrastructure significant and so R&E (now negative!) Region specific effects as before
Findings As before, positive impact of agr sp on high vam Now both Restricted and Extended are significant Investment keeps driving results Infrastructure significant and so R&E (now negative!) Region specific effects as before
Findings As before, positive impact of agr sp on high vam Now both Restricted and Extended are significant Investment keeps driving results Infrastructure significant and so R&E (now negative!) Region specific effects as before
Findings Very much the same results as before in terms of signs and significance Incremental spending is significant and negative but negligible in magnitude
Findings Very much the same results as before in terms of signs and significance Incremental spending is significant and negative but negligible in magnitude
Findings Very much the same results as before in terms of signs and significance Incremental spending is significant and negative but negligible in magnitude
Findings Civil servants per capita not significant % of budget executed over approved or % own resources invested significant but negligible Political party in office (different from central government) not significant Per capita social spending not significant
Findings Civil servants per capita not significant % of budget executed over approved or % own resources invested significant but negligible Political party in office (different from central government) not significant Per capita social spending not significant
Findings Civil servants per capita not significant % of budget executed over approved or % own resources invested significant but negligible Political party in office (different from central government) not significant Per capita social spending not significant
Conclusions • 2 facts: large increases in agr spending and lower vulnerability to food insecurity in Bolivia • The link between the two facts is no so clear: • Looking at levels of spending, it seems that agr spending goes where is most needed • A larger effect is observed when we allow for time to elapse • When incorporating incremental spending, the sign implies some effectiveness in reducing high vulnerability • But its magnitude shows a very small effect when significant
Two final thoughts • These results are in line with previous evidence of decentralization leading to increased spending and investments where needed most but with only –at best– partial success (Faguet, Inchauste) • 2 methodological caveats: • Proper account of (desirable) endogeneity • Further refinement of Food Security categories
Distributional effects of tariff reforms in Cote d’Ivoire(on going) StefaniaLovo, Jose Cuesta & Hassan Zaman
Tariff reform and nutrition in Cote d’Ivoire • CdI immersed in two trade integration processes working in opposite directions: • Interim Economic Partnership Agreement with EU: elimination of tariffs for 80% of the EU imports • Common External Tariff with ECOWAS: potential increase of tariffs for rice, flour, edible oil and alcoholic beverages • Tariff reforms will affect prices for critical foodstuffs, differently across commodities and across households • How tariff reform in C d’Ivoire might affect nutritional outcomes across socioeconomic groups?
Several “housekeeping” issues • Aggregate 115 food categories in 2008 ENV into manageable categories 9 categories: imported rice, flour, vegetable oils, sugar, alcoholic drinks, cereals, vegetables and fruits, meats and fish, milk & dairy, other. • Convert reported consumption units into metric units Use standard conversion factors (Smith and Subandoro 2007, USDA) and econometric techniques (using household expenditure, reported q, regional metric prices) • Convert consumption of foodstuffs into calories and proteins Use standard tables by FAO
Empirical strategy • After conversions done, • Estimate a QUAIDS food demand system to obtain own and cross price elasticities • Simulation of price changes across food ‘groups’ affected by tariffs on consumption and, ultimately, nutritional intakes • Comparison across groups
A few additional issues • No population weights in the survey • However, rich information available to exposure to conflict and intra-household allocation • Analyze effects by • Poor / Non Poor: • N/S; • male vs female dominant hhs; • farmers vs non farmers;
Looking forward • Relatively low nutritional effects hypothesized • Relatively low tariffs of some critical foodstuff (for example rice) may lead to small tariff changes • The opposite effects of two diverging trade processes may lead to small net nutritional impacts • A first look at the sources of calories and nutrients for P and NP suggest that there are not substantive difference in their sources
Many thanks!! www.worldbank.org/poverty