Download
1 / 1
10 likes | 180 Views
Acknowledgements This work was supported by the National Science Foundation’ Office of Polar Programs, contracts OPP0000373 and ARC-0856268. We wish to express our gratitude to numerous individuals who operated the instruments at Barrow and Summit.

E N D
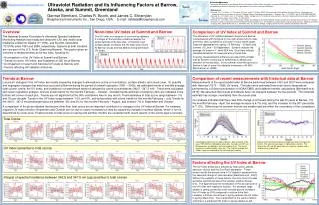
Acknowledgements This work was supported by the National Science Foundation’ Office of Polar Programs, contracts OPP0000373 and ARC-0856268. We wish to express our gratitude to numerous individuals who operated the instruments at Barrow and Summit. Ultraviolet Radiation and its Influencing Factors at Barrow, Alaska, and Summit, Greenland References Bernhard, G., C. R. Booth, J. C. Ehramjian, R. Stone, and E. G. Dutton (2007), Ultraviolet and visible radiation at Barrow, Alaska: Climatology and influencing factors on the basis of version 2 National Science Foundation network data, J. Geophys. Res., 112, D09101, doi:10.1029/2006JD007865. Bernhard, G., C. R. Booth, and J. C. Ehramjian. (2008). Comparison of UV irradiance measurements at Summit, Greenland; Barrow, Alaska; and South Pole, Antarctica, Atmos. Chem. Phys., 8, 4799–4810. Bernhard, G., C. R. Booth, and J. C. Ehramjian. (2010). Climatology of Ultraviolet Radiation at High Latitudes Derived from Measurements of the National Science Foundation’s Ultraviolet Spectral Irradiance Monitoring Network, in: UV Radiation in Global Climate Change: Measurements, Modeling and Effects on Ecosystems, edited by W. Gao, D. L. Schmoldt, and J. R. Slusser, 544 pp., Tsinghua University Press, Beijing and Springer, New York. Germar Bernhard, Charles R. Booth, and James C. Ehramjian Biospherical Instruments Inc., San Diego, USA. E-mail: nsfdata@biospherical.com • Overview • The National Science Foundation’s Ultraviolet Spectral Irradiance Monitoring Network has measured ultraviolet (UV) and visible solar irradiance at Barrow, Alaska (71°19’N), and Summit, Greenland (72°35’N) since 1991 and 2004, respectively. Systems at both locations are now part of the U.S. Arctic Observing Network. This poster gives an overview of measurements at the two sites, focusing on: • A comparison of the UV Index at Summit and Barrow, • Trends of ozone, UV Index, and irradiance at 345 nm at Barrow, • A comparison of recent and historical UV levels at Barrow, and • Factors affecting UV radiation at Barrow. Noon-time UV Index at Summit and Barrow Comparison of UV Index at Summit and Barrow The difference of UV radiation between Summit and Barrow is emphasized with the figure on the right where the UV Index at the two sites is plotted as a function of solar zenith angle. Data are segregated into spring (15 February – 30 April) and summer (15 June – 30 September). Symbols indicate the average UV Index in 1°-wide SZA-bins. Error bars indicate standard deviations of measurements in these bins. In spring, measurements at Barrow are about 20% smaller than at Summit, mostly due to differences in albedo and elevation of the two sites. In the summer, when the ground at Barrow is free of snow, the disparity increases to 40-50% [Bernhard et al., 2008]. The UV Index is a measure of sun-burning radiation. It is larger at Summit than at Barrow despite the similar latitude of the two sites. At Summit, high surface albedo increases the UV Index year round. At Barrow, clouds and low albedo during fall reduce UV levels. Summit Barrow Trends at Barrow Long-term changes in the UV Index are mostly caused by changes in atmospheric ozone concentrations, surface albedo, and cloud cover. To quantify and segregate changes that may have occurred at Barrow during the period of network operation (1991 – 2009), we estimated trends of monthly average total column ozone, the UV Index, and irradiance in a wavelength band not affected by ozone concentrations (342.5 - 347.5 nm). Trend were calculated with linear regression analysis, and are shown below for the months February – October. Decadal trends and their uncertainty (±2σ) are indicated in the bottom-left corner of each plot. Trends are not significant at the 95% confidence level in any month. Trend estimates of total ozone range between -1% and 3% per decade. Trends in the UV Index range between -10% and 0%, and anticorrelate with ozone trends for the months February – July. Trends for the 342.5 - 347.5 nm wavelength band are between -2% and 2% for the months February – August, and exceed -7% in September and October. A comparison of the plots indicates that factors other than total ozone are an important contributor to changes in the UV Index at Barrow. For example, negative UV Index trends in September and October are not due to ozone increases but may be caused by changes in surface albedo, which in turn is determined by snow cover. Positive trends in total ozone for spring and summer months are consistent with recent reports of the ozone layer’s recovery. Comparison of recent measurements with historical data at Barrow Measurements of the spectroradiometer at Barrow performed between 1991 and 2007 were compared with historical (1973 – 1980) UV levels. The latter were estimated from total ozone observations performed by a Dobson photometer of NOAA/CMDL and radiative transfer calculations [Bernhard et al., 2010]. We assumed that clouds and albedo have not changed between the two periods. The historical estimate has a larger uncertainty than the recent data. Our analysis indicates that there was little change in UV levels during the last 30 years at Barrow. For the months February - April, the average increase is 4-7% only, and the increase for the 90th percentile is 7-13%. Differences for summer months are smaller and are within the uncertainty of the comparison. Total Ozone Climatology of noon-time UV Index at Barrow. Measurements of the years 1991-2007 are indicated by black dots. Average, and 10th and 90th percentiles are plotted as thick red and blue lines. The overall maximum is emphasized by a grey line. The historical average and 10-90% range are indicated by thin lines and grey shading. Ratio of recent to historical data calculated from data of the figure on the left. The ratio of the averages is indicated by a red line. The ratios of the 10th and 90th percentiles are shown by a broken and a solid blue line, respectively. UV Index (sensitive to total ozone) Factors affecting the UV Index at Barrow Factors affecting the UV Index at Barrow The UV Index at Barrow is affected by total ozone, albedo, aerosols, clouds, and the Sun-Earth separation. These factors modify the annual cycle in UV radiation expected from the seasonal change in solar elevation [Bernhard et al., 2007]. Without the variation of these factors, the noon-time UV Index would be symmetrical about the summer solstice (broken line). The figure shows the modification of the annual cycle of the UV Index with respect to solstice. For example, large albedo in spring caused by snow-covered ground increases the UV Index by 30% compared to solstice (blue line). Likewise, a thicker ozone layer in spring reduces the UV Index in spring (black line). The overall effect of the various factors (red line) is a enhanced UV Index in spring relative to fall. Integral of spectral irradiance between 342.5 and 347.5 nm (not sensitive to total ozone)