Download
1 / 19
190 likes | 461 Views
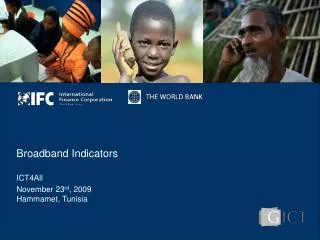
Broadband Indicators ICT4All November 23 rd , 2009 Hammamet , Tunisia. Facts Using Indicators. The number of broadband subscribers around the globe, on either fixed or mobile connections, is likely to exceed one billion for the first time during 2009. (OECD)

E N D
Broadband Indicators ICT4All November 23rd, 2009Hammamet, Tunisia
Facts Using Indicators • The number of broadband subscribers around the globe, on either fixed or mobile connections, is likely to exceed one billion for the first time during 2009. (OECD) • For every 10 percentage-point increase in broadband penetration, GDP growth can increase by up to 1.38 percent (World Bank 2009) • One fibre optic strand the width of a human hair currently has the capacity to support 3 billion simultaneous phone conversations. That is equivalent to every person in the world on the phone with someone else at the same time (OECD). • Performance/price of broadband connections is continuing to double every 12-15 months on average (OECD).
ICT Core Indicators The “ICT Core Indicators” are the international common denominator • A4 - Fixed broadband Internet subscribers per 100 inhabitants • A5 - Mobile broadband subscribers per 100 inhabitants • A6 - International Internet bandwidth per inhabitant (bits/sec/person) • A8 - Fixed broadband Internet access tariffs (per month), in US$, and as a percentage of monthly per capita income • HH11 - Proportion of households with access to the Internet by type of access (narrowband, broadband (fixed, mobile)) • B9 - Proportion of businesses using the Internet by type of access (narrowband, broadband (fixed, mobile)) The Partnership on Measuring ICT for Development
Outcomes Outputs Activities Inputs Indicators Logic Model • Long-term, macro, widespread improvement in society Impacts Results • Intermediate effects of outputs on clients • Immediate products and services produced • Tasks undertaken to transform inputs to outputs Implementation • Financial, human, and material resources Binnendijk, 2000
Outcomes Outputs Activities Inputs Rural Rollout of Broadband Example • Increase in GNI/cap in rural areas; reduction of poverty Impacts Results • Time savings for rural inhabitants; Cost savings for rural inhabitants; Increase in broadband-enabled SME activity in rural areas; Increase in ICT skills in rural areas • Increase in % of population covered by broadband services; increase in bandwidth available in rural areas • Rolling out the network Implementation • Money, engineers, Private Sector partner, hardware, software, USF, Regulation Binnendijk, 2000
Specifically Broadband Public Sector View: Policy Private Sector View: Profit New Subscribers Technology types Network speed Spectrum allocation Next generation, Killer Apps Capex, Investment ROI, ARPU Performance to Price ratio Investment Climate / Risk • Sector Structure:Competition / Regulation • Penetration / Usage • Universal Access / Rural • Quality, Speed • Affordability • BB Applications / BB as Enabler of other Sectors / BB as Service Delivery Tool • Education / Skills
Sector Structure / Competition / Regulation • Sector Structure – Monopoly, Partial, CompetitionE.g. for Fixed Wireless Broadband, Ethiopia = M; Algeria = P; Ghana = C. (ITU) • Number of OperatorsEgypt: Number of Broadband operators = 8 (NTRA) • Unbundling the Local Loop? • Universal Access? • Spectrum Management? In short • Indicators on policies and regulations that close market gaps and make markets work, often not quantitative
Penetration / Usage • Overall PenetrationFixed / Mobile Broadband subscribers per 100 inhabitants (ITU) • IndividualHouseholds with broadband access (%) (OECD) • BusinessesBusiness broadband penetration (OECD) • Community Access (kiosks, post office, schools)Schools with Broadband Access (% of total schools) ITU 2008
Quality / Speed • International Internet bandwidth per inhabitant (bits/sec/person) • Average advertised download speeds, by technology (e.g. DSL, Cable, Fibre) • Average advertised upload speeds, by technology • Fastest advertised connection offered by the incumbent operator • Bit/data cap limits, average among surveyed firms with caps, by technology
Affordability • Variety due to packages with different speeds, bit caps, technology, billing methods of post/prepaid. • ITU uses price baskets. • OECD has uses average monthly subscription price for very (a) low-speed, (b) medium-speed, (c) high-speed, (d) very high-speed connections • Tariffs as % of GNI/cap • What we would like to see is low prices as % of GNI/cap = affordable broadband.
Fixed Broadband Tariffs in EU Analysis Mason. Ultra-fast broadband means downstream bandwidth of 30Mbps or more.
MNA Broadband Prices Arab Advisors Group (residential, 256 kbs)
BB as Enabler • Quantify the impact on delivery of through Applications – eHealth, Distance Learning, m-Banking • Study of BB as enabler of other Sectors, e.g. through Trade • Requires: Digital literacy, ICT skills development, ICT Education, Private Sector Development.
Private Sector Focus: Technology • Wired: VDSL/ADSL, cable networks, fiber optic, Powerline • Wireless: Mobile 3G 4G, WiMAX, Satellite • International (submarine), domestic (backbone) and last mile • Sharing infrastructure (roads, electricity, water, sewerage, railroads, towers, ducts) • E.g. Fibre networks are likely to generate 20–30% more ARPU than DSL networks (Analysys Mason 2009).
Mobile Broadband: Spectrum / Costs Factors Typical costs of providing WiMAXcoverage for a large population using 2.5GHz or 3.5GHz spectrum: to provide good outdoor coverage using 3.5GHz, rather than 2.5GHz, spectrum results in a substantial 33% increase in associated costs. If indoor coverage is added to the equation, the cost of using 3.5GHz spectrum is 73% higher than if using 2.5GHz spectrum Analysis Mason
Thank you AnatLewinalewin@worldbank.org