Download
1 / 17
180 likes | 416 Views
A synthetic gene-metabolic oscillator. Fung et al. 2005. Conceptual design of oscillatory circuit. Realization of the oscillatory circuit using the acetate pathway in E. coli. AcP : acetyl phosphate OAc - : acetate HOAc protonated form of acetate. Pta : phosphate acetyltransferase

E N D
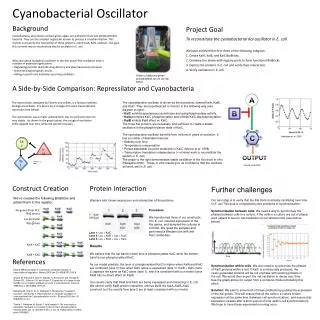
A synthetic gene-metabolic oscillator Fung et al. 2005
Realization of the oscillatory circuit using the acetate pathway in E. coli AcP: acetyl phosphate OAc-: acetate HOAc protonated form of acetate Pta: phosphate acetyltransferase Ack: acetate kinase Acs: acetyl-CoA synthetase The induction of Acs by the presence of acetate is under catabolite repression by glucose in wild-type strain so as to avoid futile cycling.
AcP LacI Acs Pta E. coli strain and plasmid constructs A GFP is ligated downstream of a plasmid-borne LacI-repressibletac promoter, to be used as a readout. Acetyl phosphate in the M2 pool activatesacs expression, and at the same time, represses pta expression indirectly.
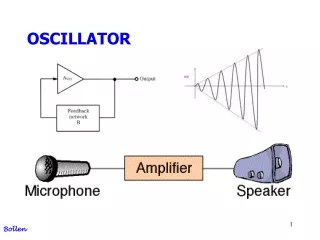
Representative single cell dynamics About 60% of the initial colonies oscillate with varying amplitude and a period of 45 ± 10 min (for a total of 85 cells in 10 experiments), for a total duration of at least 4 h.
Representative oscillation dynamics of two sibling cells Comparison of sibling cells shows skipped or delayed peaks (compare filled and open circles), which might be partially explained by uneven distribution of cellular materials.
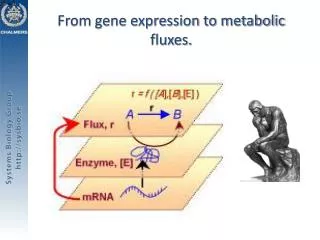
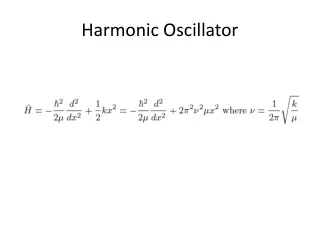
ODE model Metabolites (AcCoA, AcP, OAc−, and HOAc) Proteins LacI, Pta, and Acs
Enzyme kinetics Michaelis-Menten kinetics is the Michaelis-Menten constant. http://en.wikipedia.org/wiki/Michaelis-Menten
Gene expression kinetics Hill function TF binding reaction: At equilibrium, where K describes the binding affinity between the TF and promoter. The fraction of promoter binding sites is The expression rate is
Rate expressions and parameters Michaelis-Menten kinetics Gene expression kinetics
Experimental verification Fructose Glycolytic flux decreases in the following order: glucose, fructose, mannose, and glycerol. mannose glycerol
Stability analysis is related to the gene copy number for the synthesis of protein i (where i is LacI, Pta or Acs).
Experimental result Effect of acetate on metabolator dynamics. 10mM external acetate suppressed oscillation but 0.1mM did not.
Discussions • The unique design of the metabolator represents a fusion of metabolic and transcriptional oscillation. • The metabolator illustrates the use of metabolic fluxes to control biological oscillation. • Negative feedback is typically used to stabilize a system, however, it tends to be unstable if the time lag in feedback increases.