Download
1 / 12
130 likes | 295 Views
An X-ray Study of the Bright Supernova Remnant G296.1-0.5 with XMM-Newton. SNRs and PWNe in the Chandra Era Boston, MA – July 8 th , 2009 Daniel Castro, CfA-USB Collaborator: Pat Slane, CfA . Outline. Introduction Radio and other observations X-ray study with ROSAT ASCA Observations

E N D
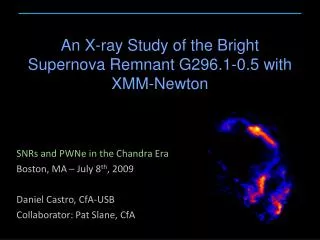
An X-ray Study of the Bright Supernova Remnant G296.1-0.5 with XMM-Newton SNRs and PWNe in the Chandra Era Boston, MA – July 8th, 2009 Daniel Castro, CfA-USB Collaborator: Pat Slane, CfA
Outline • Introduction • Radio and other observations • X-ray study with ROSAT • ASCA Observations • Morphology of G296.1-0.5 • XMM Observations • XMM Spectral Study • Abundances in G296.1-0.5 • Summary
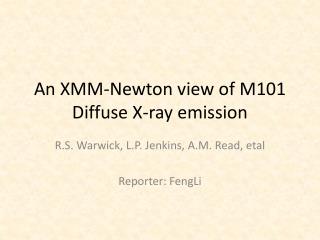
Introduction MOST, 0.843 GHz (Whiteoak & Green, 1996) • Radio Observations (Molonglo Cross) • Clark et al., 1975 • Caswell & Barnes, 1983 • Bright SW limb • 33’ mean angular size • Distance estimate from mean Σ-D relation = 7.7 kpc • Possibly two different SNRs • Other observations • Very bright in the X-ray range (Einstein IPC count rate = 3.2 cnts s-1) • Optical observations (Longmore et al., 1977) reveal faint filaments and nebulosity in Hα and [SII]. • Distance estimate ~ 4 kpc
ROSAT (Hwang & Markert, 1994) • 3 bright regions (little spectral variation) • nH ~ 2 x1021cm-2 • Single temperature (~0.2 keV) underabundant plasma (3% solar) • Two thermal components (~0.1 and 0.35 keV) with solar abundances Left: MOST image with PSPC contours. Right: PSPC image • ROSAT PSPC data revisited • Low column density • nH = 8 (±1) x 1020 cm-2 • Single temperature (~0.5 keV) ionized plasma (solar abundances) PSPC spectrum of G296.1-0.5, single temperature ionized plasma fit
ASCA Observations ASCA GIS image with PSPC contours • GIS Spectrum: • Low column density (>6x1020 cm-2) • Single temperature ionized plasma (~ 0.5 keV) • Mg and Si lines are present GIS spectrum of G296.1-0.5, single temperature ionized plasma fit
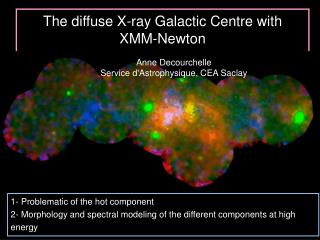
Morphology of G296.1-0.5 • CO Emission Map • Integrated CO emission suggest higher densities towards darker areas • No velocity slice provides sufficient information to determine the location of dense material regions in relation to the object • No apparent excess absorption towards the SE, in X-rays • Shock interaction with cloud of dense material in this direction could explain apparent half-shell morphology (like it has been suggested for CTB 109, Sasaki et al., 2004) ROSAT PSPC image with contours of line-of-sight CO emission XMM EPIC RGB image of CTB 109 (Sasaki et al., 2004)
XMM Observations XMM image of G296.1-0.5, with pointing regions in white • G296.1-0.5 was observed with three pointings of XMM-Newton • Exposure times (after removing flare and high background periods): • P1 ~ 12 ks • P2 ~ 10 ks • P3 ~ 8 ks • Consistent with other X-ray observations • G296.1-0.5 was observed with three pointings of XMM-Newton • Exposure times (after removing flare and high background periods): • P1 ~ 12 ks • P2 ~ 10 ks • P3 ~ 8 ks • Consistent with other X-ray observations • Brightest region located in the northern limb
XMM Observations Mosaic RGB image of EPIC MOS2 data • G296.1-0.5 was observed with three pointings of XMM-Newton • Exposure times (after removing flare and high background periods): • P1 ~ 12 ks • P2 ~ 10 ks • P3 ~ 8 ks • Consistent with other X-ray observations • Brightest region located in the northern limb R: 0.3 – 0.7 keV G: 0.7 – 1.0 keV B: 1.0 – 3.0 keV
XMM Spectral Study • Preliminary spectral analysis shows an emission profile well described by a single temperature ionized plasma, in all regions of the SNR • The spectral fits favor low absorption (nH < 8 x 1020 cm-2) Spectra from region A from EPIC MOS1 (black) and MOS2 (red) Mosaic image of EPIC data, with extraction regions nH = 3.0 +0.7-1.9 x 1020 cm-2 kTA = 0.52+0.04-0.04 keV net = 7.7+2.6-1.2 x 10¹⁰ s.cm-3
XMM Spectral Study • Assuming Sedov expansion: • Swept-up Mass ~ 2 (d1kpc 5/2) M • Density ~ 0.2 (d1kpc -1/2)cm-3 • Age ~ 4000 d1kpc yr Spectra from region A from EPIC MOS1 (black) and MOS2 (red) Mosaic image of EPIC data, with extraction regions nH = 3.0 +0.7-1.9 x 1020 cm-2 kTA = 0.52+0.04-0.04 keV net = 7.7+2.6-1.2 x 10¹⁰ s.cm-3
Abundances in G296.1-0.5 • Apparent enhanced abundance of some metals (N, Ne and Mg) • Possible underabundance of Oxygen • The spectral fit, in most regions of the the SNR, is significantly improved with an overabundance of Nitrogen • The circumstellar winds of Wolf-Rayet and LBV stars are known to be enriched in N, and O deficient Mosaic image of EPIC data, with extraction regions Relative Abundances for region A
Summary • G296.1-0.5 is a bright, nearby supernova remnant • Spectral characteristics show little variation from region to region of the object, suggesting this is a single remnant • Apparent enhanced abundance of some metals (N, Ne and Mg), together with underabundance of Oxygen. Possibly explained by interaction of the shock with the circumstellar wind from WR or LBV progenitor star