Download
1 / 27
270 likes | 447 Views
Capacity Simulation of High Density Indoor WLAN Systems. Date: 2013-09-16. Authors:. Abstract. Preliminary results from simulation of high density indoor WLAN systems. The static simulation is similar to one used for cellular applications. Topics. WLAN multi-cell performance aspects

E N D
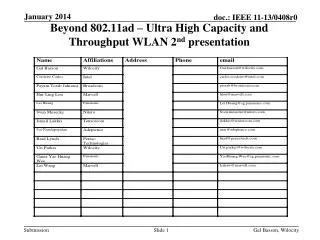
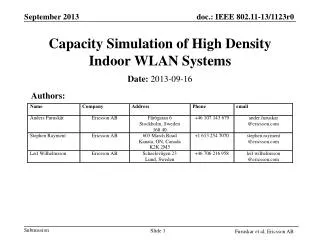
Capacity Simulation of High Density Indoor WLAN Systems Date: 2013-09-16 Authors:
Abstract Preliminary results from simulation of high density indoor WLAN systems. The static simulation is similar to one used for cellular applications
Topics • WLAN multi-cell performance aspects • Models and assumptions • Results • Summary
WLAN Multi-cell Performance Aspects • 802.11n and 802.11ac have similar physical layer characteristics as cellular systems, e.g. LTE • Modulation, channel coding, MIMO capabilities • But… • The CSMA-based MAC limits densification • Nodes that hear each other cannot be active at the same time • This creates a re-use in the time domain • Operation in uncontrolled environments with external interference will further limit performance • Not modeled here
Models and Assumptions • IEEE 802.11n modulation and coding rates • 2.4 or 5GHz • Frequency reuse varied between 1 and 12 vs isolated AP • Choose channels that maximize distance between APs that use the same frequency • One single 20MHz carrier per AP • AP and STA power 100mW (EIRP) • CS (Carrier Sense) threshold -85dBm • 2x2 MIMO in DL and UL • No external interference • File transfer traffic • 75% in downlink and 25% in uplink • MAC PDU size 65KB
Deployment Scenario • An office-like building with 80x50m footprint • Ten floors of height 3m • Interior walls every 10m (10x10m rooms) • Winner II propagation • Free-space propagation with inner wall loss of 12dB, and floor loss of 17dB for first floor and 4dB for following floors • Log-normal shadowing with standard deviation 8dB • Subscriber density 1/16m2 250/2500 per floor/building • ~30 subscribers per AP • 8 APs per floor, randomly deployed per floor, all floors same
Traffic Load per AP vsMonthly Volume per User • Subscriber density 1/16m2 250/2500 per floor/building • 200 busy hours per month • Traffic per subscriber and month v busy hour traffic per floor • Assume 10 GB per monthper sub x 250 subs per floor / 200 busy hours per month = 27Mbps per floor or 3.4Mbps per AP
AP to STA Radio Characteristics September 2013 • Good coverage • Well above total gain of -100dB which corresponds to -80dBm received power • Good isolation geometry due to walls and floors
Cell Isolation September 2013 • Propagation as a function of distance and floor • Total loss <105dB (received power >-85dBm) some two to three walls or floors away 2.4GHz 5.0GHz
Cell Isolation September 2013 • An active AP triggers carrier sensing (>-85dBm) in 7.1 and 5.9 neighbor APs (on average) in 2.4GHz and 5.0GHz respectively • The graph shows averagereceived power from neighbor APs in orderof strength x x x x x x x x x x x x x x x x x x x x
Performance Measurement Method • Cell-edge (5thpercentile) and mean user throughput vstraffic load • ‘How much can the system be loaded before user experience gets unacceptable?’ Datarates decrease when load increases due to increased interference and more active users sharing channel Traffic load Traffic load
Isolated APs, 2.4GHz, DL • 5th percentile throughput is at most 40Mbps • Utilization approaching 75% (CSMA efficiency)
Reuse 3, 2.4GHz, DL • 5th percentile throughput is at most 12Mbps • Utilization approaching 30%
Reuse 1, 2.4GHz, DL • 5th percentile throughput is at most 7Mbps • Utilization approaching 10%
Reuse 1, 3, Isolated, 2.4GHz, UL • Same trends as in downlink
Capacity • Maximum served traffic for cell-edge (5th percentile) user throughput of at least 5Mbps Isolated [100%] Isolated [100%] Reuse 3 [100%] Reuse 3 [100%]
Spectral Efficiency • Capacity divided by total spectrum usage in used direction • Spectral Efficiency = Capacity / (reuse * 20MHz x f) • Downlink= 0.75 Uplink = 0.25 • Increases with tighter reuse, but still rather low Reuse 3 Reuse 3
Reuse 1-12, Isolated, 5GHz, DL • Same trend as in 2.4GHz • Slightly better than 2.4GHz due to better isolation
Reuse 1-12, Isolated, 5GHz, UL • Same trends as downlink
Capacity 5GHz • Maximum served traffic for cell-edge (5th percentile) user throughput of at least 5Mbps Isolated [100%] Isolated [100%] Reuse 12 [100%] Reuse 12 [100%]
Spectral Efficiency • Capacity divided by total spectrum usage in used direction • Spectral Efficiency = Capacity / (reuse * 20MHz x f) • Downlink= 0.75 Uplink = 0.25 • Increases with tighter reuse, but still rather low
Next Steps • Inter-cell carrier sensing based only on AP-to-AP channel, need to look at STA as well • Include hidden nodes • Include RTS/CTS • Currently not explicitly modeled, but no hidden nodes assumed either • Model more realistic modulation rate algorithms • Model effects of more realistic AP channel selection and placement
Summary • High capacity multi cell systems can be built with WLAN technology (!) • Inter-cell carrier sensing limits performance • Possible to mitigate with more channels • Are there more spectrally efficient solutions? • We have a good baseline to assess enhancements
References [1] I. Siomina, A. Furuskär, and G. Fodor. A mathematical framework for statistical QoS and capacity studies in OFDM networks, Proc. of IEEE PIMRC ’09, Sep. 2009.