Download
1 / 27
270 likes | 519 Views
Introduction to the Georgia Student Growth Model. Student Growth Percentiles. Why focus on student growth?. A growth model will allow educators to move beyond status-based questions to ask critical growth-related questions. Status What percentage of students met the state standard?

E N D
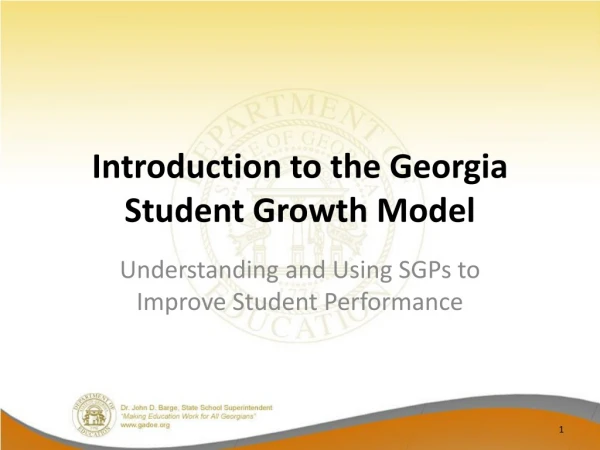
Introduction to the Georgia Student Growth Model Student Growth Percentiles
Why focus on student growth? • A growth model will allow educators to move beyond status-based questions to ask critical growth-related questions. • Status • What percentage of students met the state standard? • Did more students meet the state standard this year compared to last year? • Growth • Did this student grow more or less than academically-similar students? • Are students growing as much in math as in reading? • Are students on track to reach or exceed proficiency? • The GSGM will provide student-level diagnostic information, improve teaching and learning, enhance accountability (CCRPI), and serve as one of multiple indicators of educator effectiveness (TKES and LKES).
Describing Student Achievement • Status • Comparing student achievement to a target (e.g., AMOs used to calculate AYP) • Improvement • Comparing student achievement using different students across time (e.g., 3rd grade math achievement in 2009 vs. 2010) • Growth • Measuring student achievement across time using the same students
Growth vs. Value-Added • A growth model describes change in student achievement across time • A growth model becomes value-added when the growth is attributed to an entity (a teacher, a school, etc.) • In many models, the value-added is the difference between predicted performance and actual performance • The model uses information about a student (prior achievement, demographic information, etc.) to predict how that student will perform. The student’s actual performance is compared to his predicted performance. The difference is considered value-added. • The GSGM does not predict performance; it describes observed student growth.
Addressing Common Concerns • Understandability • Ownership of methodology and data • Cost and operations • Missing data • Stability • Outliers • Growth at the extremes / floor and ceiling effects
2011 SGP = 1 2010 4th Grade Math Scale Score = 990 2011 5th Grade Math Scale Score = 850 2011 SGP = 99 2010 4th Grade Math Scale Score = 990 2011 5th Grade Math Scale Score = 990
What are Student Growth Percentiles? • A student growth percentile (SGP) describes a student’s growth relative to other students statewide with similar prior achievement • Calculations based solely on achievement • SGPs not only show how individual students are progressing, but they also can be aggregated to show how groups of students, schools, districts, and the state are progressing
SGPs for Individual Students • Each student obtains a growth percentile, which indicates how his or her current achievement compares with that of his or her academic peers • Academic peers are other students statewide with a similar score history • Priors are the historical assessment scores used to model growth • Growth percentiles range from 1 to 99 • Lower percentiles indicate lower academic growth and higher percentiles indicate higher academic growth • Students also receive growth projections and growth targets, which describe the amount of growth needed to reach or exceed proficiency in subsequent years
Understanding Percentiles 50th percentile 50% 50% A distribution, for example, of height, weight, or academic growth The 50th percentile is the value below which 50% of the distribution lies.
Aggregating SGPs • There are multiple ways of aggregating SGPs (such as for a classroom, school, or district) • Median – the median growth percentile for all students • Growth distribution – divide the growth percentile range (1-99) into intervals and report the percentage of students demonstrating growth in each interval • Percentage meeting a goal – the percentage of students demonstrating at or above a specified level of growth
Calculating the Median SGP • Imagine that the list of students on the left are all of the students in a 5th grade class. • The 11 students are sorted in order of their SGP from low to high. • The median SGP is the middle value, where 50% of students have a lower SGP and 50% have a higher SGP.
Exploring Growth Distribution Low growth Typical growth High growth median Percentile Range median Note: For illustrative purposes only.
Interpreting SGPs • Anna’s reading growth percentile is 54 • Anna grew at a rate greater than 54% of academically-similar students in reading Lower growth Typical growth Higher growth
Interpreting SGPs • The median reading growth percentile for Anna’s school is 65 • The typical student in Anna’s school grew at a rate greater than 65% of academically-similar students • Anna grew at a lower rate in reading compared to the other students in her school on “average” Lower growth Typical growth Higher growth
Growth Over Time • Because SGPs are normative, meaning growth percentiles describe a student’s growth relative to other students in the state in a given year, how do we compare results over time? • A baseline will be used as a reference point so change in overall growth can be observed from year to year • Without using a baseline, the median SGP for the state would be 50 every year – absolute changes in a school’s growth could not be observed since the state as a whole is moving too • The baseline is an average of multiple years of data in order to allow for a more stable comparison • A baseline has been set for CRCT reading, ELA, math, and science. Due to changes in the social studies test, the social studies baseline will be set in 2013. EOCTs are a mix of baseline- and cohort-referenced SGPs.
Growth Over Time Without setting a baseline… State Median This year = 50 Next year = 50 Two years = 50 etc. …the state median will always be 50 with half of students below 50 and half above 50
Growth Over Time With setting a baseline… State Median This year = 50 Next year = 55 Baseline year Two years = 60 …the state median can change from year to year, representing statewide change in growth over time
Growth to Proficiency • How do we know if a student’s growth is enough to be on track to reach or exceed proficiency? • SGPs analyze historical student assessment data to model how students perform on all state assessments and the amount of growth they demonstrate in between • This information is used to create growth projections and growth targets for each student • The growth projection tells us where on the assessment scale a student may score next year for all levels of possible growth (1st-99th percentile) • The growth target tells us, based on where students are now, how much they need to grow to reach or exceed proficiency in the future
Growth Projections and Targets Exceeds Meets Does Not Meet High Target 2 Typical Target 1 Low This Year Future
Assessment Inclusion • The CRCT and EOCT assessments will be included in the model. • The model will transition to the use of PARCC assessments once they are implemented in Georgia. • While growth percentiles can be reported when PARCC is first implemented, baselines and growth projections will be delayed. Multiple years of data are necessary. • Retests for both CRCT and EOCT (beginning in 2012) will be utilized. The higher of the main administration and retest score will be used.
Priors • Priors are the historical assessment scores being used to model growth • The immediate consecutive prior is required to produce growth percentiles • For example, an 8th-grade student must have a 7th-grade CRCT score in order to receive a growth percentile • Two years of priors will be used (one year will be used when two years are not available) • For example, growth percentiles for an 8th-grade student would have his or her 7th- and 6th-grade CRCT scores as priors
EOCT Course Progressions • For EOCTs, both prior achievement and course progressions (including year taken) must be considered. • Students engaging in a common sequence will receive SGPs: • ELA: CRCT reading/ELA → 9th Grade Lit → American Lit • Math: CRCT math → Math I → Math II • Science: CRCT science → Physical Science/Biology → Biology/Physical Science • Social Studies: US History → Economics • EOCT SGPs will be a mix of cohort- and baseline-referenced SGPs until enough years of data is available • Cohort: Math I, Math II, US History • Baseline: 9th Grade Literature, American Literature, Physical Science, Biology, Economics
Model Features • Conceptually easy to understand, communicate, and utilize • Can be communicated to educators as well as parents and other stakeholders • Everyone will be involved in the process and can understand, make meaning of, and utilize the data • Does not require a vertical or developmental scale • We are not examining the change in scale scores, rather, we are examining student performance relative to other students • Provides an appropriate reference point for the amount of growth a student demonstrates (the growth of academically-similar peers) • Utilizes multiple years of prior achievement data
Model Features • Serves as both a norm-referenced and criterion-referenced measure of growth • Provides information on observed and future growth (the amount of growth needed to meet state standards) • Does not have floor or ceiling effects • Students can demonstrate all levels of growth regardless of achievement level • Robust to outliers • Extreme observations do not drastically affect summary measures • Methodology is freely available, enabling GaDOE to build the infrastructure to support and sustain the model • Have external technical support to implement and verify the model
Questions? • For questions regarding the Georgia Student Growth Model, please contact: Melissa Fincher Associate Superintendent of Assessment and Accountability mfincher@doe.k12.ga.us or (404) 651-9405 Allison Timberlake Program Manager, Growth Model atimberlake@doe.k12.ga.us or (404) 463-6666