Fat Tails
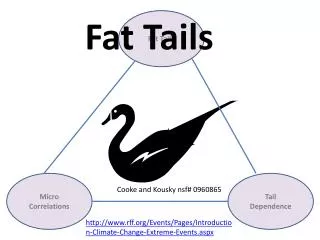
Fat Tails. Fat Tails. Cooke and Kousky nsf # 0960865. Micro Correlations. Tail Dependence. http://www.rff.org/Events/Pages/Introduction-Climate-Change-Extreme-Events.aspx. “Nice” distributions don’t surprise. Someday, you’ll meet a taller person. Tallest so far. Next record.

Fat Tails
E N D
Presentation Transcript
Fat Tails Fat Tails Cooke and Kousky nsf# 0960865 Micro Correlations Tail Dependence http://www.rff.org/Events/Pages/Introduction-Climate-Change-Extreme-Events.aspx
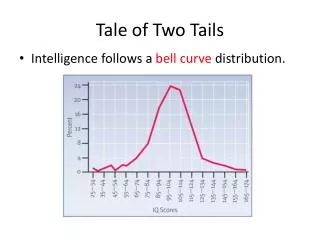
“Nice” distributions don’t surprise Someday, you’ll meet a taller person Tallest so far Next record • Next record
Catastrophes are Different! Stock market Hurricanes Insurance
Nice distribution Women’s height [cm] Bigger is less bigger Mean excess Average height above heloise Mean excess curve decreasing
Fat Tails: Natural disasters Worse is more worse Mean Excess Average above Heat1 Mean excess curve increasing
Fat Tail heuristics Historical averages ‘average out’ US crop insurance claims mean excess US crop insurance claims running average Variance is finite Variance is Infinite
Fat Tail Heuristics Historical averages just keep growing US Flood Claims per $ Income by County and Year
Katrina cost 100$BWhat’s the chance that the Next Katrina will cost >200$B?
Ask someone from St. Tammany County, LA: ‘After Katrina, flood loss claims in your county totaled $240 per dollar income (2000 dollars); in the next flood at least as bad as Katrina, what do you expect your (2000) dollar loss per dollar income to be?”
Answer: $4,000 US Flood Claims per $ Income by County and Year
Sobering Data • Tail Risk Show Background on Fat Tail Distributions http://www.rff.org/News/Features/Pages/Understanding-Fat-Tailed-Distributions-and-What-They-Mean-for-Policy.aspx


![TAILS: COBWEB 1 [1]](https://cdn1.slideserve.com/2500750/tails-cobweb-1-1-dt.jpg)