Download
1 / 54
550 likes | 801 Views
Tale of Two Tails. Intelligence follows a bell curve distribution . Tale of Two Tails : From Mental Retardation to Genius.

E N D
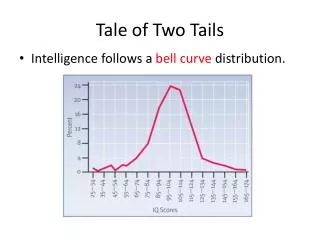
Tale of Two Tails • Intelligence follows a bell curve distribution.
Tale of Two Tails: From Mental Retardation to Genius • It discovered by the German mathematician K.F.Gauss. The majority of scores fall toward the middle, with progressively fewer scores toward the tails, forming the shape of a bell. • The bell curve estimates the distribution of IQ scores in the general population.
Mental Retardation=intellectual disability • Characterized by • childhood onset, before 18 age. • low IQ (below about 70) and • inability of dailyfunctioning. Gullibility (vulnerability to being duped by others) is a criterion for MR. • Around 1% of US population (mostly males), 0,8 % of Turkish population fulfill the criteria for MR.
Mental Retardation • MR is classified into four levels: • Mild=educable (Moron/Debile) IQ: 50-70 • Moderate= trainable (Imbecile) IQ:30-50 • Severe (Imbecile) IQ:20-30 • Profound (Idiot) IQ<20-25 Mild forms of MR are due to a mix genetic and environmental influences. Severe forms of MR are often the results of rare genetic mutations or accidents during birth.
Mental Retardation • The more severe the retardation, the less likely it is to run in families. • There are over 200 different causes, most common is Fragile X syndrome, which is produced by a mutation on the X chromosome [females have 2 copies of X chromosome and males only one] and Down syndrome, which is the result of an extra copy of chromosome 21. Down syndrome is a typical with a flat nose, a short neck, upwardly slanted eye and a protruding tongue. Down syndrome is related with the birth mother’s age. • phenylketonuria
Most individuals with Down syndrome have mild or moderate MR. Nevertheless, many have been successfully normal into traditional classrooms.
Genius • Refers to the top 2% of IQ scores. • Large portion of genius occupy certain professions – doctors, lawyers, engineers, professors. • In the 1920s, Terman followed people with 135 or higher IQ. Terman’s “Termites” showed that genius do not “burn out” or have higher rates of mental illness. • They earned doctoral degrees. • Terman’s result agreed with the popular notion that there is an intimate link between madness and genius. They may be at risk for depr and loneliness.
Genius • What makes a genius, like Chris Langan? • Genetic factors play a role, but so do practice and dedication. • Edison said: “genius is 1% inspiration, 99% perspiration.” Practice makes perfect. • Intellectual brilliance with little effort is very unrealistic.
Are Hollywood movies like the movie Good Will Hunting accurate in theirportrayal of childhood or adolescent geniuses as exerting minimal effort to make amazing intellectual discoveries? Why or why not? • Answer: No, because research shows that such discoveries always require a decade or more of hard, concentrated work in a specific area.
Genetic Influences on IQ • What are the relative roles of nature and nurture in IQs development? We can study genetic influences on psychological characteristics in 3 ways: • 1. family studies • 2. twin studies • 3. adoption studies. • Family studies confirm that IQ runs in families. Intellectually brilliant individuals had many 1st degree relatives (parents, siblings, and children) who were also brilliant, but fewer 2nd degree relatives. Sibling IQs correlate at .5, cousins at .15
Genetic Influences on IQ • Identical=monozygotic; Fraternal=dizygotic • monozygotic twins share twice as many of their genes on average as dizygotic twins, we can compare the correlations in IQ in these two different twin types. • Twin studies show monozygotic twin correlations of .7-.8, dizygotic of .3-.4. In almost all cases, studies of twins reared together have offered evidence of higher monozygotic than dizygotic twin correlations for IQ. • This finding tells us that IQ is influenced by genetic factors. The twin findings don’t tell us which genes are relevant to INT, but the scientists tried to identify specific genes for INT.
Twin studies of INT compare the mental performance of identicalversus fraternaltwins.
Genetic Influences on IQ • Twins reared apart are as similar in IQ as twins reared together. Because twins reared apart are rare, the sample size of the studies are low. • Adoption studies examine the extent to which children adopted into new homes resemble their adoptive X biological parents. They allow us to separate environmental effects from genetic effects on IQ. • Adopted children who come from deprived environments show an increase in IQ when adopted into more enriched environments. At the other side, adopted children’s IQs tend to be similar to their biological parents’ IQs. Adoption studies point to the influence of environment, but support important of genetics on IQ.
Many children adopted from environments of severe deprivation, such as this orphanage, show increases in IQ after immersion in a healthier and more attentive adoptive environment.
Environmental Influences • Both environment and genes affect IQ scores. What environmental factors influence IQ? Environmental influences include social environment (school and parents) and biological environment (food and exposure to toxic substances, such as lead). • How we conceptualize INT may influence our INT. Those that think IQ is fixed entity tend to take less academic risks, challenging themselves less. • Birth order? Are older siblings wiser? Zajonc stated that later born children tend to be less INT than earlier born children. IQ declines steadily with increasing number of children in a family. • Parents with lower IQs are more likely to have many children than are parents with higher IQs. Children from larger families have slightly lower IQs than children from smaller families.
Environmental Influences • Does schooling make us smarter? Autopsy studies show that educated people have more synapses than less-educated ones. In addition, the number of years of schooling correlates between .5 and .6 with IQ scores. • Amount of schooling seems to exert a causal influence on IQ.
Children’s IQs tend to drop significantly during summer vacations, suggesting an environmental influence on IQ.
Environmental Influences • Can we boost IQ with early educational (preschool) interventions?Early intervention programs produce short-term increases in IQ, these increases don’t persist after the programs end.
The federal Head Start program was launched in the 1960s to give disadvantaged preschoolers a jump-start on their education. Studies show that Head Start programs typically produce short-term increases in IQ, but that these increases fade with time.
Environmental Influences • A self-fulfilling prophecy: Expectancy effects on IQ. Rosenthal and Jacobson wanted to examine the effects of teacher expectancies on IQ. • Rosenthal and Jacobson administered the IQ test to students with a fake name. 20 % of students were “bloomers”. Researchers misled the teachers. They had randomly selected the students as bloomers. After a year, they retested, these students had higher IQ scores than the others. There is small impact of expectancy effects by teachers on IQ. Teachers may positively reinforce these students’ learning by smiling at, nodding their heads.
Poverty and IQ • Social and economic deprivation can adversely affect IQ. • Jensen’s cumulative deficit study, a difference that grows over time. Older siblings consistently had lower IQs than younger siblings, with a steady decrease. He explained that siblings experienced more intellectual deprivation as they aged. • Lack of proper nutrition and exposure to lead may lead to lower IQs. • Scientific controversy regarding impact of breastfeeding on IQ.
Lead exposure can arise from many sources in everyday life and may contribute to decreased IQ. Nevertheless, the causal association between lead intake and IQ remains controversial.
Flynn Effect • Political scientist J. Flynn noticed this phenomenon. The average IQ of the population has been rising by about 3 points every 10 years. • Most researchers agree that it is likely the result of environmental changes on IQ: • People may become more experienced at taking tests. • Increased complexity of modern world: TV, e-mail etc. • Better nutrition • Changes at home and school: Nucleous families give more time to children. Children spend more time in school.
Flynn Effect. Research on the Flynn effect demonstrates that IQ scores have been increasing in many countries across several decades. The causes of this effect remain unclear. (Source: Flynn, 1999)
Group differences in IQ • 1) differences between men and women • 2) differences among races • Trying to be as objective as possible is important. We must avoid emotional reasoning. • In 2005, Harward University President Summers stated that women enter the world with a genetic disadvantage in science and math.
Sex Differences in IQ • Most research finds few or no average differences between males and females.
Sex Differences in IQ • Females tend to do betteron some 1. verbal tasks, like spelling, writing, and pronouncing words 2. arithmetic calculation, like adding or subtracting numbers and 3. detecting and recognizing emotions in others, like distinguishing among faces that display different emotions. (There is no good evidence that women talk more than men. ) • Males tend to do better on spatial ability tests, like mental rotation and geography.
Mental Rotation Task. Men tend to do better than women on tests of mental rotation, which require subjects to figure out which “comparison” shape on the right matches the “standard” shape on the left. You may want to try your hand (or your mind, to be more exact) at these two items.
Men and women tend to differ in how they solve spatial problems.
Causes of Sex Differences • Some sex differences, like spatial ability, may be biological, rooted in genes. • Most of the sex differences in science and math ability are environmental. • Under-representation of women in the hard sciences is the result of societal factors, such as discrimination and society’s expectations.
Racial Differences in IQ In the 1960s, Jensen proposed a genetic basis for racial differences in IQ. Average IQ scores differ among races. It has been replicated more times. • African-Americans and Hispanic Americans score lower than Caucasians. Asian-Americans score higher than Caucasians. • Jews score slightly higher than non-Jews. • Why do these differences exist?
For whom the bell curve tolls?? • Some argues that some races are innately superior to others. • Racial “superiority” is not answered by data. • IQ differences appear to be narrowing over last decades. We can’t use race as a basis for any person’s IQ. • Instead, racial differences in IQ appear to be largely or completely environmental in origin, reflecting the difference resources and opportunities available to individuals of different races.
Reconciling Racial Differences • Imagine you have two identical groups of plants. • One group gets plenty of water and light, the other gets a minimal amount. • What will happen?
Good water and light Minimal water and light
Reconciling Racial Differences • The differences between groups are due to environment; within groups are due to genetics. • Within-group heritability is the extent to which a trait, like IQ, is heritable within groups, such as women. • Between-group heritabilityis the extent to which the difference in this trait between groups, such as women and men, is heritable. Within-group heritability doesn’t necessary imply between-group heritability. • Equal environments show equal IQs, no “boost” from Caucasian ancestry.
Reconciling Racial Differences • Are tests biased against certain groups and in favor of others? Test bias is a tendency of a test to predict outcomes better in one group than another. • Differencesdo not appear to be due to test bias on INT tests. • Average differences between groups do not necessarily indicate test bias.
Research shows that in virtually every country ever studied, girls are better readers than boys (Halpern, 2004). Does this finding show that tests of reading are biased against boys? Why or why not?
Stereotype threat • refers to the fear that we may confirm a negative group stereotype. It creates a self-fullfilling prophecy. It can impair individual’s performance on IQ tests. • It can be activated in the lab, but may not generalize to the real world. • So, broad societal differences are most likely cause of IQ differences, not genetics.
Stereotype threat can lead African American students to perform worse on tests on which they believe members of their race tend to do poorly.
Creativity • Often measured using tests of divergent thinking, that’s the capacity to generate many different solutions to problems, “outside the box” thinking. • “Uses of an Object” test • But we also need to be good at convergent thinking, that’s finding the single best answer to a problem. • We shouldn’t confuse INT & creativity. Many intelligent people aren’t creative.
Creativity • Only mildly correlated with IQ (.2-.3). • Evidence of a link between creativity and bipolar disorder. • Increases quantity of work, but not quality. Van Gogh, Gauguin; Dickinson, Twain, Hemingway; Tchaikovsky, Schumann suffered from BAD. • Best predictor of quality of work is quantity of work.
A Graph of Robert Schumann’s Productivity. The German composer Robert Schumann had bipolar disorder.His productivity increased dramatically during “hypomanic” (mild manic)episodes and decreased during depressive episodes.
Interests and intellect • High levels of scientific & math ability > investigating the working of nature. • High levels of verbal ability > art & music. • Poor levels of spatial & math ability > helping others. • What we’re good at tells us about what we like to do.
Emotional Intelligence: Is EQ as important as IQ? • The ability to understand our own and other’s emotions. • Several subcomponents: *capacities to appreciate, understand and recognize one’s emotions *to control one’s emotions *to adapt one’s emotions to diverse situations. • People with low EQ are prone to some psychological problems, like depr & substance abuse. • Not clear that differs much from personality. • Does not predict job performance beyond general IQ.
Item Similar to That on a Test of Emotional Intelligence. How would you do on a test of EQ? Try your hand at this item, modeled after those on EQ measures.