統計學 Fall 2003
統計學 Fall 2003. 授課教師:統計系余清祥 日期:2003年11月18日 第十週:抽樣與抽樣分配. Chapter 7 Sampling and Sampling Distributions. Simple Random Sampling Point Estimation Introduction to Sampling Distributions Sampling Distribution of Sampling Distribution of Properties of Point Estimators


統計學 Fall 2003
E N D
Presentation Transcript
統計學 Fall 2003 授課教師:統計系余清祥 日期:2003年11月18日 第十週:抽樣與抽樣分配
Chapter 7Sampling and Sampling Distributions • Simple Random Sampling • Point Estimation • Introduction to Sampling Distributions • Sampling Distribution of • Sampling Distribution of • Properties of Point Estimators • Other Sampling Methods n = 100 n = 30
Statistical Inference • The purpose of statistical inference is to obtain information about a population from information contained in a sample. • A population is the set of all the elements of interest. • A sample is a subset of the population. • The sample results provide only estimates of the values of the population characteristics. • A parameter is a numerical characteristic of a population. • With proper sampling methods, the sample results will provide “good” estimates of the population characteristics.
什麼是統計? • 統計學是研究定義問題、運用資料蒐集、整理、陳示、分析與推論等科學方法, 在不確定(Uncertainty)情況下, 做出合理決策的科學。
為什麼要抽樣? • 為什麼只看一部份的母體? 普查(Census):逐一檢查母體的所有個體。例如:戶口普查、工商業普查。 普查需要較長的時間、較多的經費與人力,往往只有政府負擔得起。(政府也是每十年普查一次,其他時間輔以問卷調查、公務統計等等彌補資料的不足。) 有時抽樣是唯一可行的方法。
抽樣的實例 • 品質管制(Quality Control) 為確保品質,產品出廠時須經過檢查。但逐一檢查耗費過多的時間及金錢,通常每一批抽一個(或幾個)檢查。 毀滅性抽樣(如鞭炮、罐頭等等產品) • 健康檢查 抽血、切片或抹片檢查
對樣本的要求 • 因為我們將從樣本推測出母體的原貌,抽出的部分必須能反映全體的特性,也就是說樣本需能代表母體。 樣本代表性!!! 最忌諱「瞎子摸象」
Simple Random Sampling • Finite Population • A simple random sample from a finite population of size N is a sample selected such that each possible sample of size n has the same probability of being selected. • Replacing each sampled element before selecting subsequent elements is called sampling with replacement. • Sampling without replacement is the procedure used most often. • In large sampling projects, computer-generated random numbers are often used to automate the sample selection process.
Simple Random Sampling • Infinite Population • A simple random sample from an infinite population is a sample selected such that the following conditions are satisfied. • Each element selected comes from the same population. • Each element is selected independently. • The population is usually considered infinite if it involves an ongoing process that makes listing or counting every element impossible. • The random number selection procedure cannot be used for infinite populations.
Point Estimation • In point estimation we use the data from the sample to compute a value of a sample statistic that serves as an estimate of a population parameter. • We refer to as the point estimator of the population mean . • s is the point estimator of the population standard deviation . • is the point estimator of the population proportion p.
Sampling Error • The absolute difference between an unbiased point estimate and the corresponding population parameter is called the sampling error. • Sampling error is the result of using a subset of the population (the sample), and not the entire population to develop estimates. • The sampling errors are: for sample mean |s - s | for sample standard deviation for sample proportion
Example: St. Andrew’s St. Andrew’s University receives 900 applications annually from prospective students. The application forms contain a variety of information including the individual’s scholastic aptitude test (SAT) score and whether or not the individual desires on-campus housing.
Example: St. Andrew’s The director of admissions would like to know the following information: • the average SAT score for the applicants, and • the proportion of applicants that want to live on campus. We will now look at three alternatives for obtaining the desired information. • Conducting a census of the entire 900 applicants • Selecting a sample of 30 applicants, using a random number table • Selecting a sample of 30 applicants, using computer-generated random numbers
Example: St. Andrew’s • Taking a Census of the 900 Applicants • SAT Scores • Population Mean • Population Standard Deviation • Applicants Wanting On-Campus Housing • Population Proportion
Example: St. Andrew’s • Take a Sample of 30Applicants Using a Random Number Table Since the finite population has 900 elements, we will need 3-digit random numbers to randomly select applicants numbered from 1 to 900. We will use the last three digits of the 5-digit random numbers in the third column of a random number table. The numbers we draw will be the numbers of the applicants we will sample unless • the random number is greater than 900 or • the random number has already been used. We will continue to draw random numbers until we have selected 30 applicants for our sample.
Example: St. Andrew’s • Use of Random Numbers for Sampling 3-Digit Applicant Random NumberIncluded in Sample 744 No. 744 436 No. 436 865 No. 865 790 No. 790 835 No. 835 902 Number exceeds 900 190 No. 190 436 Number already used etc. etc.
Example: St. Andrew’s • Sample Data Random No.NumberApplicantSAT ScoreOn-Campus 1 744 Connie Reyman 1025 Yes 2 436 William Fox 950 Yes 3 865 Fabian Avante 1090 No 4 790 Eric Paxton 1120 Yes 5 835 Winona Wheeler 1015 No . . . . . 30 685 Kevin Cossack 965 No
Example: St. Andrew’s • Take a Sample of 30 Applicants Using Computer-Generated Random Numbers • Excel provides a function for generating random numbers in its worksheet. • 900 random numbers are generated, one for each applicant in the population. • Then we choose the 30 applicants corresponding to the 30 smallest random numbers as our sample. • Each of the 900 applicants have the same probability of being included.
Using Excel to Selecta Simple Random Sample • Formula Worksheet Note: Rows 10-901 are not shown.
Using Excel to Selecta Simple Random Sample • Value Worksheet Note: Rows 10-901 are not shown.
Using Excel to Selecta Simple Random Sample • Value Worksheet (Sorted) Note: Rows 10-901 are not shown.
Example: St. Andrew’s • Point Estimates • as Point Estimator of • s as Point Estimator of • as Point Estimator of p • Note:Different random numbers would have identified a different sample which would have resulted in different point estimates.
The value of is used to make inferences about the value of m. The sample data provide a value for the sample mean . Sampling Distribution of • Process of Statistical Inference Population with mean m = ? A simple random sample of n elements is selected from the population.
Sampling Distribution of • The sampling distribution of is the probability distribution of all possible values of the sample mean . • Expected Value of E( ) = where: = the population mean
Sampling Distribution of • Standard Deviation of Finite Population Infinite Population • A finite population is treated as being infinite if n/N< .05. • is the finite correction factor. • is referred to as the standard error of the mean.
Sampling Distribution of • If we use a large (n> 30) simple random sample, the central limit theorem enables us to conclude that the sampling distribution of can be approximated by a normal probability distribution. • When the simple random sample is small (n < 30), the sampling distribution of can be considered normal only if we assume the population has a normal probability distribution.
Example: St. Andrew’s • Sampling Distribution of for the SAT Scores
Example: St. Andrew’s • Sampling Distribution of for the SAT Scores What is the probability that a simple random sample of 30 applicants will provide an estimate of the population mean SAT score that is within plus or minus 10 of the actual population mean ? In other words, what is the probability that will be between 980 and 1000?
Example: St. Andrew’s • Sampling Distribution of for the SAT Scores Using the standard normal probability table with z = 10/14.6= .68, we have area = (.2518)(2) = .5036 Sampling distribution of Area = .2518 Area = .2518 980 990 1000
Sampling Distribution of • The sampling distribution of is the probability distribution of all possible values of the sample proportion • Expected Value of where: p = the population proportion
Sampling Distribution of • Standard Deviation of Finite Population Infinite Population • is referred to as the standard error of the proportion.
Example: St. Andrew’s • Sampling Distribution of for In-State Residents The normal probability distribution is an acceptable approximation since np = 30(.72) = 21.6 > 5 and n(1 - p) = 30(.28) = 8.4 > 5.
Example: St. Andrew’s • Sampling Distribution of for In-State Residents What is the probability that a simple random sample of 30 applicants will provide an estimate of the population proportion of applicants desiring on-campus housing that is within plus or minus .05 of the actual population proportion? In other words, what is the probability that will be between .67 and .77?
Example: St. Andrew’s • Sampling Distribution of for In-State Residents For z = .05/.082 = .61, the area = (.2291)(2) = .4582. The probability is .4582 that the sample proportion will be within +/-.05 of the actual population proportion. Sampling distribution of Area = .2291 Area = .2291 0.77 0.67 0.72
Properties of Point Estimators • Before using a sample statistic as a point estimator, statisticians check to see whether the sample statistic has the following properties associated with good point estimators. • Unbiasedness • Efficiency • Consistency
Properties of Point Estimators • Unbiasedness If the expected value of the sample statistic is equal to the population parameter being estimated, the sample statistic is said to be an unbiased estimator of the population parameter.
Properties of Point Estimators • Efficiency Given the choice of two unbiased estimators of the same population parameter, we would prefer to use the point estimator with the smaller standard deviation, since it tends to provide estimates closer to the population parameter. The point estimator with the smaller standard deviation is said to have greater relative efficiency than the other.
Properties of Point Estimators • Consistency A point estimator is consistent if the values of the point estimator tend to become closer to the population parameter as the sample size becomes larger.
Other Sampling Methods • Stratified Random Sampling • Cluster Sampling • Systematic Sampling • Convenience Sampling • Judgment Sampling
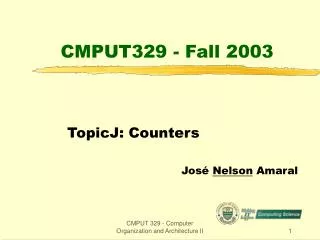
Stratified Random Sampling • The population is first divided into groups of elements called strata. • Each element in the population belongs to one and only one stratum. • Best results are obtained when the elements within each stratum are as much alike as possible (i.e. homogeneous group). • A simple random sample is taken from each stratum. • Formulas are available for combining the stratum sample results into one population parameter estimate.
分層隨機抽樣(Stratified Random Sampling) ○○○○○○ ○○○○○ ○ ○ 第一層 ○○○○ ○○ XXXXX XXXX X XXX XX 第二層 第三層 抽樣
Stratified Random Sampling • Advantage: If strata are homogeneous, this method is as “precise” as simple random sampling but with a smaller total sample size. • Example: The basis for forming the strata might be department, location, age, industry type, etc.
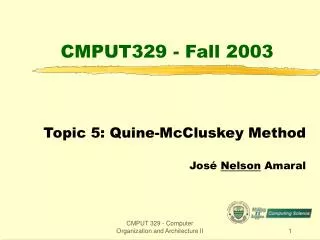
Cluster Sampling • The population is first divided into separate groups of elements called clusters. • Ideally, each cluster is a representative small-scale version of the population (i.e. heterogeneous group). • A simple random sample of the clusters is then taken. • All elements within each sampled (chosen) cluster form the sample. … continued
○○○○○○○ ××× △△△△△ A ○○○○○○○ ××× △△△△△ B ○○○○○○○ ××× △△△△△ C ○○○○○○○ ××× △△△△△ ○○○○○○○ ××× △△△△△ D ○○○○○○○ ××× △△△△△ ○○○○○○○ ××× △△△△△ E ○○○○○○○ ××× △△△△△ F 集體隨機抽樣(Cluster Random Sampling) 抽出A、D
Cluster Sampling • Advantage: The close proximity of elements can be cost effective (I.e. many sample observations can be obtained in a short time). • Disadvantage: This method generally requires a larger total sample size than simple or stratified random sampling. • Example: A primary application is area sampling, where clusters are city blocks or other well-defined areas.
Systematic Sampling • If a sample size of n is desired from a population containing N elements, we might sample one element for every n/N elements in the population. • We randomly select one of the first n/N elements from the population list. • We then select every n/Nth element that follows in the population list. • This method has the properties of a simple random sample, especially if the list of the population elements is a random ordering. … continued
Systematic Sampling • Advantage: The sample usually will be easier to identify than it would be if simple random sampling were used. • Example: Selecting every 100th listing in a telephone book after the first randomly selected listing.
Convenience Sampling (便利抽樣) • It is a nonprobability sampling technique. Items are included in the sample without known probabilities of being selected. • The sample is identified primarily by convenience. • Advantage: Sample selection and data collection are relatively easy. • Disadvantage: It is impossible to determine how representative of the population the sample is. • Example: A professor conducting research might use student volunteers to constitute a sample.
Judgment Sampling (立意抽樣) • The person most knowledgeable on the subject of the study selects elements of the population that he or she feels are most representative of the population. • It is a nonprobability sampling technique. • Advantage: It is a relatively easy way of selecting a sample. • Disadvantage: The quality of the sample results depends on the judgment of the person selecting the sample. • Example: A reporter might sample three or four senators, judging them as reflecting the general opinion of the senate.