Download
1 / 1
10 likes | 155 Views
World Radiation Center. Physikalisch-Meteorologisches Observatorium Davos. XMM observations of the WR+O system Gamma Velorum Thomas Dumm (ETH), Manuel Güdel (PSI), Werner Schmutz (PMOD/WRC), Marc Audard (PSI), Hansruedi Schild (ETH), Maurice Leutenegger (Columbia), Karel van der Hucht (SRON).

E N D
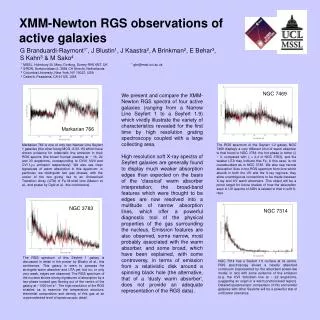
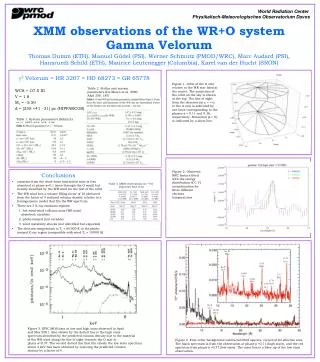
World Radiation Center Physikalisch-Meteorologisches Observatorium Davos XMM observations of the WR+O system Gamma Velorum Thomas Dumm (ETH),Manuel Güdel (PSI), Werner Schmutz (PMOD/WRC), Marc Audard (PSI), Hansruedi Schild (ETH), Maurice Leutenegger (Columbia), Karel van der Hucht (SRON) g2 Velorum = HR 3207 = HD 68273 = GR 65778 WC8+O7.5 III V = 1.8 Mv = -5.50 d = [258 +4131] pc (HIPPARCOS) Figure 1. Orbit of the O star relative to the WR star fixed at the center. The projection of the orbit on the sky is shown at the top. The line of sight from the observer (at z = +) to the O star is indicated by two lines corresponding to the phases = 0.11 and 0.36, respectively. Periastron ( = 0) is indicated by a short line. Table 2. Stellar and system parameters (De Marco et al. 2000 A&A 358, 187) Table 1. System parameters (Schmutz et al. 1997 A&A 328, 219) Figure 2. Observed RRC feature fitted with the energy distribution of C VI recombination for three different electron temperatures. • Conclusions • emission from the wind-wind interaction zone is less absorbed at phase f=0.1 (seen through the O wind) but heavily absorbed by the WR wind for the rest of the orbit. • The WR wind has a volume filling factor of 16 (deduced from the factor of 4 reduced column density relative to a homogeneous model that fits the WR spectrum • There are 3 X-ray emission regions: • hot wind-wind collision zone (WR wind absorbed; variable) • photo-ionized (not variable) • wind instability shocks (not identified but expected) • The electron temperature is Te < 60‘000 K in the photo-ionized X-ray region (compatible with wind-Te 10’000 K) Table 3. XMM observations of g2 Vel (exposure time in h) Ne IX He-a C VI Ly a C VI RRC Ne X Ly a O VIII Ly a C V RRC O VII He-a C VI Ly b C VI Ly g Ne X Ly a Ne IX He-a Figure 3. EPIC MOS data at low and high state observed in April and May 2001. Also shown by the dotted line is the high state spectrum absorbed by the predicted column density due to the material of the WR wind along the line of sight towards the O star at phase =0.37. The second dotted line that fits closely the low state spectrum above 2 keV has been obtained by reducing the predicted column density by a factor of 4. Figure 4. First order background subtracted RGS spectra, corrected foreffective area. The black spectrum is from the observation at phase=0.11 (high state), and the red spectrum from phase =0.37 (low state). Theinset box is a blow up of the low state observation.