Download
1 / 32
320 likes | 600 Views
National Weather Service Introduction to Flooding Jason Elliott Senior Service Hydrologist NWS Baltimore/Washington Open House September 22, 2012. Today’s Topics. Area of Responsibility Flood Forecasting / Meteorology Types of Flooding Flooding Facts / Safety NWS Flood Products.

E N D
National Weather Service Introduction to Flooding Jason ElliottSenior Service Hydrologist NWS Baltimore/Washington Open House September 22, 2012
Today’s Topics • Area of Responsibility • Flood Forecasting / Meteorology • Types of Flooding • Flooding Facts / Safety • NWS Flood Products
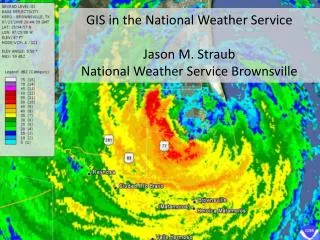
Areas of Responsibility • County WarningArea (CWA)Flash Flood • 43 Counties in 3 states • District of Columbia • 12 Independent Cities • MD Chesapeake Bay • Hydrologic ServiceArea (HSA)River Flood • Potomac Basin • Shenandoah Basin • Rappahannock Basin • West Chesapeake
River Forecast Centers (RFCs) • 13 RFCs Nationwide • Focus on river forecasting & modeling
How do we forecast flood potential? • Pre-event assessment • Forecast expected rainfall • Consider areas more prone to flooding • Put it all together!
Pre-event assessment Items to consider: • Wet ground • Current water levels • Rainfall intensity and duration • Topography • Soil (type, moisture, frozen) • Time of year (vegetation, snow cover)
Favorable Weather Patterns • Slow-moving or Stationary Fronts
Favorable Weather Patterns • High Moisture Content • Dewpoints & Precipitable Water • Slow-moving & Training (Repeating) Thunderstorms
Observations during heavy rain • Automated observations • Near-real time, but… • Not perfect (could clog or freeze, etc.) • No measurement of how much of the fallen rain is being soaked into the ground, and how much is running into streams
Precipitation Estimates • Remote Sensing • Radar • Satellite
Observations during heavy rain • Ground truth • A picture really is worth a thousand words! • Rainfall measurement / flood report / stream measurement US 301 / MD 4Upper Marlboro, MD Photo courtesy Prince Georges County EMS
Types of Flooding • Flash Flood – A flood which follows within 6 hours of heavy or excessive rainfall, a dam or levee failure, or ice jam break. • (Areal) Flood – A flood which lasts beyond 6 hours after the heavy or excessive rainfall event. Includes small stream flooding. • Coastal Flooding – the inundation of land areas caused by sea waters over and above the level of normal tidal action.
What makes a flash flood? • Typical Flash Flood Characteristics • Caused by convection (thunderstorms or intense showers) • More isolated compared to flooding • Response time is short, usually 1-2 hours, but as little as 15 mins. in urban areas (compared to 6-12 hours for flooding) • Swift Water Rescues, road closures (especially major roads), creeks and streams flood within an hour or two of the causative event • Occurs more frequently in urban areas and in terrain Flash Flood debris flownear Front Royal, VA – 2011
When does flash flooding occur? • Can occur anytime – day or night. • Approximately two-thirds of all flash flooding occurs at the night. • Most flash floodfatalities occur at night! • Flash Flooding is NOT restricted to only mountainous areas. Berkeley Springs, WV flash flood – September 1, 2012
Travel Times (in hours) 32 16 6 2 3344 47 36 30 56 45 17 6
Coastal Flooding • Prolonged onshore flow • Storm Surge from Tropical Systems • Spring Tides: the highest tides in a lunar month, around new moon when the Earth, Moon and Sun are aligned Annapolis, MD – 2003
Coastal Flooding • Two distinct peaks for positive anomalies January/February & September/October • September stands out due to tropical systems Coastal Flooding at the US Naval Academy June 2005
Floods – a major weather killer • Other than heat, floods are the #1 weather killer! • Most flood fatalities occur in cars • Most flood fatalities occur at night Most flood fatalities can be avoided!!!
Flood Safety • Take Appropriate Action! • Better forecasts and earlier warnings won’t help prevent loss of life and property unless people act. • Know your area’s flood risk! • Plan ahead – Identify where to go if told to evacuate. Choose several places (a friend’s home or a motel, or a designated shelter) • Never try to drive, swim, walk, or run through a flooded area • Children should not play in flooded areas River Road, Falmouth, VAMarch 2011
Turn Around, Don’t Drown! • If you come upon flood waters, STOP! TURN AROUND AND GO ANOTHER WAY! • Only 6 inches of fast-moving water can knock you off your feet • 2 feet of water will float an average size car…less water for smaller cars • Bottom line: never assume there is a safe way to drive through water
Flood Damages • Average: $7.6 billion per year! • 2010: $5 billion • In 2011, 75% of all Presidentially-declared disasters were at least in part flood-related • (plus three tsunamideclarations, a different typeof flood) Great Falls, MD1996
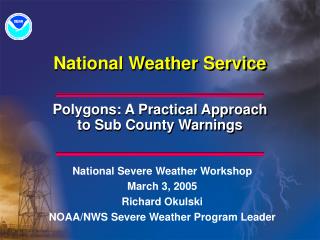
Watch vs. Warning • WATCH: Conditions are favorable for flooding to occur (>50% chance). Be alert for possible flooding during the watch period. • WARNING:Flooding is occurring or is extremely likely to occur (>75% chance). Stay out of low areas and seek higher ground if necessary! • Note: A watch does not necessarily precede a warning, especially for river flooding.
Basin-Based Warnings • Our goal is to warn for: • Where the rain is going to go • Where the water is going to flow • This meanswe may warnfor placeswhere itwillnot even rain!
Local River Assessment • Assessing flood threat at all local stream gauges • Began in September 2011 • About 70% complete
Advanced Hydrologic Prediction Service (AHPS) http://water.weather.gov
Questions? • Jason ElliottSenior Service HydrologistNWS Sterling, VA • jason.elliott@noaa.gov