
Initial Forward Proton Detector Data Analysis
E N D
Presentation Transcript
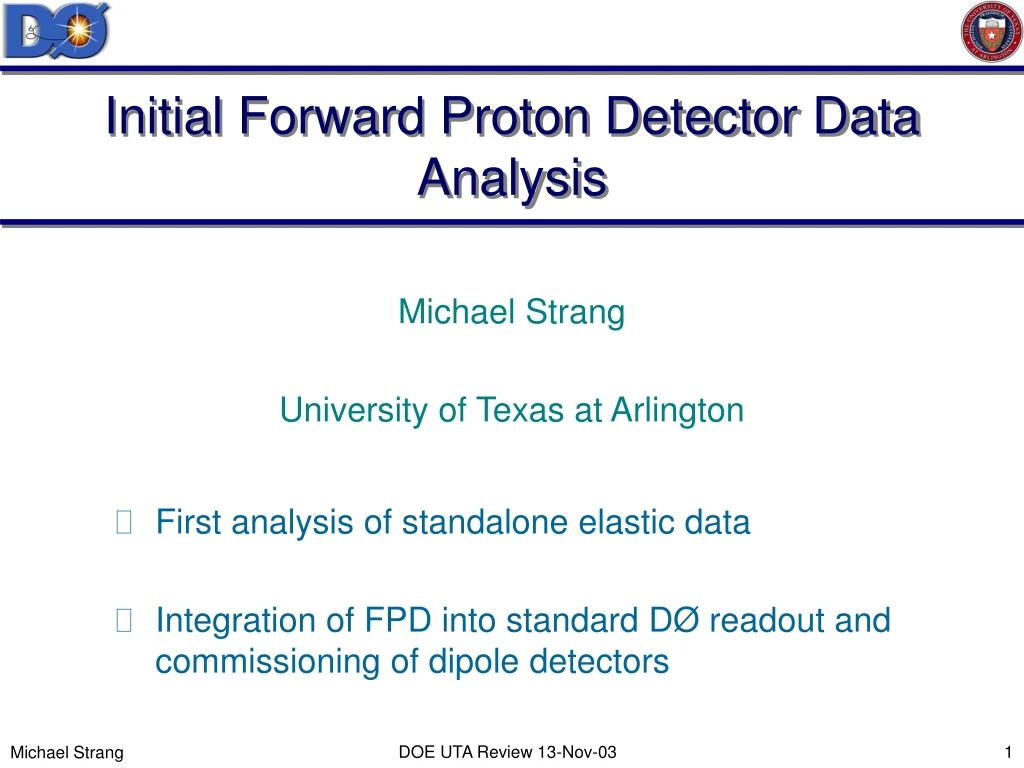
Initial Forward Proton Detector Data Analysis Michael Strang University of Texas at Arlington • First analysis of standalone elastic data • Integration of FPD into standard DØ readout and commissioning of dipole detectors DOE UTA Review 13-Nov-03
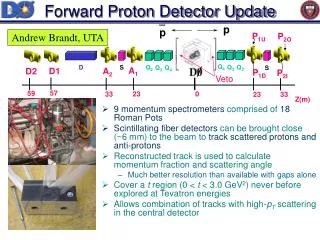
Elastic Trigger Halo Early Hits A1U A2U Pbar P P1D P2D LM VC In-time hits in AU-PD detectors, no early time hits, or LM or veto counter hits • Approximately 3 million elastic triggers taken with stand-alone DAQ • About 1% (30,000) pass multiplicity cuts • Multiplicity cuts used for ease of reconstruction and to remove halo spray background DOE UTA Review 13-Nov-03
Elastic Data Distributions After alignment and multiplicity cuts (to remove background from halo spray): =p/p dN/dt Acceptance loss Residual halo contamination The fit shows the bins that will be considered for corrected dN/dt Events are peaked at zero, as expected, with a resolution of = 0.019 DOE UTA Review 13-Nov-03
“Final” dN/dt Results After unsmearing and acceptance corrections,the data points were normalized to the points obtained by the E710 experiment The results are in excellentagreementwith the model of M. Bloch showed in the figure Warning: error bars need the contribution of the unsmearing errors in progress Dr. Jorge Molina, (LAFEX, Brazil) defended his thesis on these results 10/31/03 (first FPD thesis!) DOE UTA Review 13-Nov-03
Integrated Commissioning Overview • We have been reading out dipole detectors through AFE since February 2003 • We have had various gap triggers requiring the Luminosity Monitor not to fire along with jets of either 15 GeV, 25 GeV or 45 GeV as well as a special run with a diffractive tag trigger • We have results from standalone data collection as a basis for understanding the new system • Had problems understanding the data for a long time from a mapping problem and efforts trying to understand noise contamination through the Transition Patch Panel (TPP) DOE UTA Review 13-Nov-03
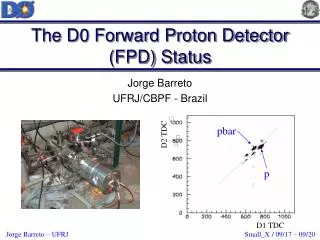
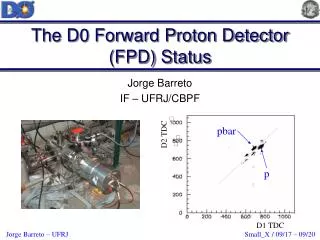
Standalone Data beam x y (0,0) D0 D2 D1 • See correlations in hit location between both detectors in same event indicating a single particle passing through both detectors (higher band on right plot), spread out over x. Data gathered with a trigger based on particles passing through trigger scintillators at detector locations • Halo particles displaced from the beam, traveling with beam momentum hit at the same y in both detectors (lower correlation on y plot), spread out over x • Excess of events at low y seem to be pbar halo as they remain after a TDC cut removing events that hit in D2 before D1 remove the rest of the lower correlation • Diffracted pbars that have lost more than 4% of their momentum are bent inwards by the dipole magnets so that they travel at an angle between D1 and D2 giving a higher y value in D2 than D1 and fall in upper correlation of y plot DOE UTA Review 13-Nov-03
JT_25TT_GapN and Special Run • Uses trigger: • one jet with 25GeV and North luminosity counters not firing • Similar correlations • Jet requirement suppresses proton halo • This is only a small sample • Uses similar trigger to standalone but only last bunch of super bunch • Similar correlations • Last bunch of super bunch has no proton halo • Sample used to get x and t distributions DOE UTA Review 13-Nov-03
Dipole Diffraction Results - Alignment All units in mm Y1 Y2 • Raw data sample has 4640 events • Reconstruction of ~50% of events • Hit patterns: Misalignment? • Hit correlations: pbar halo? • Poor and t distributions X1 Beam X2 X1 Y1 D0 Preliminary Y2 X2 t (GeV2) DOE UTA Review 13-Nov-03
Dipole Diffraction Results – Alignment II Y1 Y2 X1 X2 X1 Y2 MC Data Y2 X2 t (GeV2) All units in mm • Shifts ΔY1= ΔY2=+2mm • Cut the pbar blob (X2 > -14mm) • Fair agreement between MC and Data • More realistic and t distributions • Allow to study vs t correlation DOE UTA Review 13-Nov-03
Dipole Diffraction Acceptance Geometrical Acceptance 14σ Data Flat-t distribution 0.08 D0 Preliminary 0.06 D0 Preliminary 0.04 0.02 0. |t| (GeV2 ) |t| (GeV2 ) DOE UTA Review 13-Nov-03
Conclusions • Detectors work as designed • Elastic Data analysis is moving towards publication • Integrated data is moving towards physics results • Full 18 pot FPD system now installed. After commissioning, data analysis with full system will be forthcoming DOE UTA Review 13-Nov-03