Download
1 / 1
10 likes | 132 Views
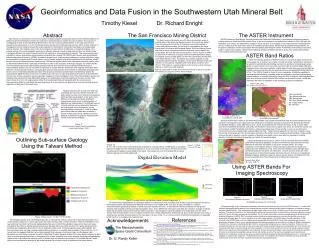
Geoinformatics and Data Fusion in the Southwestern Utah Mineral Belt. Timothy Kiesel Dr . Richard Enright. Abstract. The San Francisco Mining District. The ASTER Instrument.

E N D
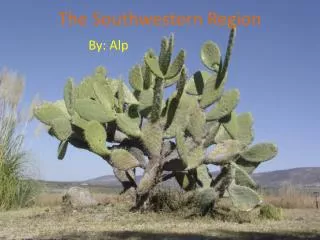
Geoinformatics and Data Fusion in the Southwestern Utah Mineral Belt Timothy Kiesel Dr. Richard Enright Abstract The San Francisco Mining District The ASTER Instrument Data Fusion is a technique in remote sensing that combines separate geophysical data sets from different platforms to yield the maximum information of each set. Data fusion was employed on multiple sources of data for the purposes of investigating an area of the Utah Mineral Belt known as the San Francisco Mining District. In the past many mineral deposits were expressed in or on the immediate surface and therefore relatively easy to locate. More modern methods of investigation look for evidence beyond the visible spectrum to find patterns that predict the presence of deeply buried mineral deposits. The methods used in this study employed measurements of reflectivity or emissivity features in the infrared portion of the electromagnetic spectrum for different materials, elevation data collected from the Shuttle Radar Topography Mission and indirect measurement of the magnetic or mass properties of deposits. The measurements were collected by various spaceborne remote sensing instruments like Landsat TM, ASTER and Hyperion and ground-based statewide geophysical surveys. ASTER’s shortwave infrared bands, that have been calibrated to surface reflectance using the atmospheric correction tool FLAASH, can be used to identify products of hydrothermal alteration like kaolinite, alunite, limonite and pyrophyllite using image spectroscopy. The thermal infrared bands once calibrated to emissivity can be used to differentiate between felsic, mafic and carbonate rock units for the purposes of lithologic mapping. To validate results from the extracted spectral profiles existing geological reports were used for ground truth data. Measurements of electromagnetic spectra can only reveal the composition of surface features. Gravimetric and magnetic information were utilized to reveal subsurface features. Using Bouguer anomaly data provided by the USGS an interpreted geological cross section can be created that indicates the shape of local igneous intrusions and the depth of sedimentary basins. By comparing the digital elevation model with a satellite photo of the area a major high angle fault system was identified that had not been clearly evaluated in previous geologic mapping. For the investigation of the Frisco Mining District, gravity and magnetic data was fused to help differentiate igneous and sedimentary rocks that might have the same density. Data fusion allows for a more thorough analysis rather than viewing each data set separately with the accompanying improvement in ability to understand the complex geology of an area and can be applied to any remote sensing data set regardless of the type of instrument used. ASTER (Advanced Spaceborne Thermal Emission and Reflection Radiometer) is a broadband multispectral remote sensing device on board the NASA satellite Terra. It can record images in the Visible Near Infrared (0.520-0.860 µm) at a resolution of 15 meters, the Short Wave Infrared (1.600-2.430 µm) at a resolution of 30 meters and the Thermal Infrared (8.125-11.650 µm) at 90 meters for a total of 15 individual spectral bands. ASTER data is available through NASA’s Jet Propulsion Laboratory and the Japan Earth Remote Sensing Data Analysis Center. ASTER has nadir pointing instruments used to capture solar radiation reflected and blackbody radiation emitted by the Earth. It also has a backwards pointing sensor used to extract elevation data. The San Francisco Mountains are a 20 mile long mountain range on eastern edge of the Basin and Range province. As a result the western front of the mountain is the site of a massive normal fault creating a classic half graben structure. On the North it is bounded by the Sevier Desert and to the East is the Escalante Desert. The Frisco Mining District was host to some of the most productive silver and copper mines in the United State. By 1910 the area had produced 17,000 oz of gold 16 million oz silver and 31 million lbs of copper worth at the time $29 million dollars. The largest sources of high grade ore were the Cactus Mine and the Horn Silver Mine (Whelan 1973). The district also contains deposits of other industrially useful metals like Tungsten, Tin and Lead. Because of the arid climate it is only sparsely vegetated with bunch grass and pinyon pine (Fig. 9). This makes it a very favorable area for remote sensing because there is so much bare earth exposed. ASTER Band Ratios Since the intensity values in an ASTER scene are recorded as digital numbers the entire image can be resolved as a matrix. This allows simple mathematical functions to be applied to spectral data like dividing one band by another or eliminating all values above a certain number. One commonly used band ratio is the Normalized Difference Vegetation Index. Because vegetation reflects Near Infrared light more than Red light an equation can be set up using the two spectral bands as variables (NIR-Red)/(NIR+Red). In Fig. 1 The NDVI is loaded as Green to mimic vegetation. Identifying vegetation is important because densely vegetated areas will completely cover the ground making spectral analysis of minerals impossible. Using the NDVI is helpful in selecting pixels that were likely to be bare earth. Positive NDVI values can be used to create a mask that eliminates the effect of vegetation on the remaining spectral end members. Figure 9 Looking SW on Indian Grave Peak (composed of quartz monzonite) The foothills are composed of Horn Silver Andesite. Figure 1 (Res. 15m) R: 2 G: NDVI ((3-2)/(3+2)) B: 1 Wah Wah Valley Hardpan Magma intrusions rich in water and sulfur can chemically alter rock into different minerals. The acidic water becomes rich in dissolved compounds which are then reprecipitated as the water cools. Different compounds precipitate at different temperatures which leaves a distinct pattern of alteration and mineralization. The different types of minerals will have various absorption features in the infrared that can be detected by remote sensing platforms. Because of a lack of reliable ground truth data this model also served as a source of likely spectral end members for linear spectral unmixing and a guide for interpreting the results of the spectral analyzer. Tgd- granodiorite Tgp- granodiorite plug Tbp- breccia pipe Ths- Horn Silver andesite Op- Pognip Group Qa- Alluvium Big Wash Graben Figure 2 (Res. 15m) R: ((4+6)/5) G: (7/5) B: (5/6) Figure 3 Excerpt from “The Geological Map of the Milford Quadrangle” Rocky Range • Because ASTER has 5 bands in the Short Wave Infrared it can identify minerals that have absorbance features in that spectrum. Knowing that, band ratios have been developed to identify the products of hydrothermal alteration like Alunite and Kaolinite (Hewson, 2005), Illite (Rowan et al., 2003) and weathered iron minerals (Volesky). In Fig. 2 yellow areas represent the presence of Kaolinite, pink areas are Alunitized volcanic breccia pipes, blue areas are unaltered country rock and red areas contain Pyrophyllite and Alunite. Looking a geological map of the area (Fig. 3) one can see that some volcanic intrusions have already been mapped (labeled as Tbp - Tertiary breccia pipes) but it is far from complete. Using free remote sensing data all of the breccia pipes exposed on the surface can be mapped without spending a large amount of time at the site in question. Also the zonation of Kaolinite and Alunite can be seen which is important in locating deposits of valuable minerals and targeting good pixels for spectral analysis. Figure 12 Porphyry Copper Deposit Model Cross Section (Lowell and Guilbert, 1970) Rebel Mine Milford, UT Outlining Sub-surface Geology Using the Talwani Method Using a technique developed by Dr. Simon Hook for the North American ASTER Land Surface Emissivity Database, bands from the Thermal Infrared that have been calibrated to emissivity are loaded as red green and blue (2009). The image undergoes a decorrelation stretch to reduce redundancy between the bands and enhance the color difference. In Fig. 4 the red areas represent rocks with high silica content like quartzite, the green are carbonates, the pink and blue areas are rocks with lower levels of silica like the quartz monzonite intrusion. This tool is invaluable for lithologic mapping. Using this image it is easy to see an alluvial fan created from the erosion of quartzite from Frisco Peak that is invisible to the naked eye. (Figure 10) R: 3 G: 2 B: 1 (False Color Infrared) Because vegetation is a strong reflector of NIR (band 3) agriculture appears as bright red while desert flora appears as a rust color. Most of the crops in this area are created by center pivot irrigation to grow alfalfa in the desert. The orange line north of Grampian Hill is a linear feature believed to be a high angle fault. Scale 1: 111,808 1 inch = 9,317 feet Digital Elevation Model Figure 4 (Res. 90m) R: 14 G: 12 B: 10 Using ASTER Bands For Imaging Spectroscopy Figure 6 Kaolinite (Al2Si2O5(OH)4) Figure 7 Alunite (KAl3(SO4)2(OH)6) Figure 5 Hydrothermal Alteration Products Figure 11 Looking NE onto the Big Wash Graben, Vertical Exaggeration: 2 Wavelength is measured in micrometers To make the best interpretation of a geological feature it is necessary to look at multiple sets of data to gain the maximum amount of information possible. Here geophysical data has been draped over a DEM in GIS. This type of data presentation is useful in understanding the geophysical settings in which economic deposits are found. In this case the desired conditions are high gravity anomaly, high magnetic intensity and high topographic areas. Since differences in Bouguer anomalies are caused by changes in density, areas with the same reading could have the same composition assuming that in general materials of a certain type have the same density. With this data there is some correlation between areas of high magnetic flux density (the red spots on the top layer) and areas of similar gravity anomaly (the teal areas on the lower layer). As seen in Fig. 12, a common product of hydrothermal alteration is magnetite which results in a anomaly in the magnetic field. Using wavelength as the Z dimension a spectral profile can be extracted for any pixel in an ASTER scene. To minimize the effects of absorbance and scattering from the atmosphere the given radiance values must be calibrated to reflectance using a program called FLAASH. This data assumes a water vapor component of 0.85 g of H2O per cm^2 and a very low amount of aerosols. The percent reflectance for the applicable spectra can be compared to a spectral library of known materials provided by the JPL and in this way minerals can be identified. Fig. 5 includes the profiles of some important products of hydrothermal alteration (Rowan et al 2003). ENVI’s spectral analyzer matched extracted spectra to minerals like kaolinite, alunite and pyrophyllite although figure 7 is more indicative of a zeolite called natrolite. One USGS study of argillic alteration in Utah concluded that ASTER data could not reliably identify pyrophyllite (Rockwell 2009). Most of the extracted spectra have absorbance features or two or more minerals because the pixel encompasses an area that is a mixture of different substances. In figure 6 the unknown is absorbing red light which is not generally recognized as a property of kaolinite. There are a few minerals that absorb in the red band and are associated with copper porphyry deposits like molybdenite and nontronite but it is more likely that there is spectral mixing with local vegetation. In order to help quantify the amount of mixing between minerals ENVI’s linear spectral unmixing algorithm was employed. In linear spectral unmixing it is assumed that the observed spectrum of a pixel is an abundance weighted average of pure end member spectra. The user must supply the pure spectral end members for comparison and results are given as positive fractional abundances that theoretically add up to 1. Values that are negative or outside of the range of 0-1 indicates that non-ideal end members were chosen. Unmixing can only accurately model pixels where there are fewer expected end members than spectral bands. Figure 13 Sea Level: -1.5 Km 113°W: 88 Km References Acknowledgements The Talwani program uses a line integral approach to estimate the vertical component of gravitational attraction for a certain distance away from a given origin point. 2D bodies are input with a certain density to create an estimation of rock type and body size which can then be manipulated by the user to match the calculated values to the observed values provided by the USGS or another geophysical survey. Because there are infinite solutions for a given gravity anomaly, borehole and stratigraphy data must be used to create the initial model. Combining gravity values with magnetic and thermal infrared data can help constrain surface lithology if there is no borehole data available. If this model (Fig. 13) is correct then it is apparent that the Cactus Stock intrusion that outcrops in the Frisco Peaks and the Beaver Lake Mountains are most likely connected beneath the Big Wash Graben. Because bodies of the same density adjacent to each other cannot be distinguished there is guaranteed to be a large amount of error when mapping morphological features like folded strata or unconformities between rocks of different age and type but same density. It is possible that the Cactus pluton is not as shallow as depicted in the model because it is covered in schist or gneisses of the same density. Bankey, V., Grauch, V.J.S., Kucks, R.P. (1998) Utah Aeromagnetic and Gravity Maps and Data. Retrieved from http://pubs.usgs.gov/of/1998/ofr-98-0761/utah.html Boardman, J. W., 1989, Inversion of imaging spectrometry data using singular value decomposition: in Proceedings, IGARSS’89, 12th Canadian Symposium on Remote Sensing, v. 4., pp. 2069-2072. Hewson, R. D. (2005) Seamless geological map generation using ASTER in the Broken Hill-Curnamona province of Australia, Remote Sensing of Environment, vol. 99, pp. 159-172. Hulley, G. C., Hook, S. J. (2009) The North American ASTER land surface emissivity database (NAALSED) version 2.0, Remote Sensing of Environment, vol. 113, no. 9, pp. 1967-1975. Rockwell, B.W. and Hofstra, A.H., 2009a, Mapping argillic and advanced argillic alteration in volcanic rocks, quartzites, and quartz arenites in the western Richfield 1° x 2° quadrangle, southwestern Utah, using ASTER satellite data (abstract): Geological Society of America Rocky Mountain Section Meeting Abstracts with Programs, Orem, Utah, May 11–13, 2009, v. 41, no. 6, p. 39. Rowan, L., Hook, S. J., Mars J. C, (2003). Mapping hydrothermally altered rocks at Cuprite, Nevada, using the Advanced Spaceborne Thermal Emission And Reflection Radiometer (ASTER), A new satellite-imaging system, Economic Geology, vol. 98, pp. 1019-1027. Schmoker, J. W. (1972). Analysis of Gravity and Aeromagnetic Data, San Francisco Mountains and Vicinity, Southwestern Utah, Utah Geological and Mineralogical Survey Whelan, J. (1973). Mineral resources of the Milford area, Geology of the Milford Area 1973, pp. 1-4. The Massachusetts Space Grant Consortium Dr. G. Randy Keller