Download
1 / 19
190 likes | 294 Views
Descriptive Statistics III REVIEW. Variability Range, variance, standard deviation Coefficient of variation (S/M): 2 data sets Value of standard scores?. Correlation and Prediction. HPHE 3150 Dr. Ayers. Variables. Dependent (ordinal/continuous: #) Presumed effect Consequence

E N D
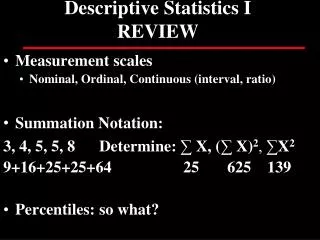
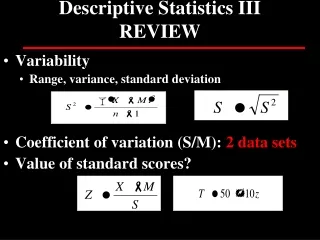
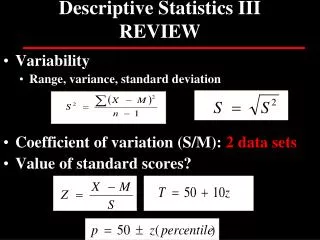
Descriptive Statistics IIIREVIEW • Variability • Range, variance, standard deviation • Coefficient of variation (S/M): 2 data sets • Value of standard scores?
Correlation and Prediction HPHE 3150 Dr. Ayers
Variables Dependent • (ordinal/continuous: #) • Presumed effect • Consequence • Measured by researcher • Predicted • Criterion • Y Independent (categorical: name) • Presumed cause • Antecedent • Manipulated by researcher • Predicted from • Predictor • X Y dv X iv
Correlation(Pearson Product Moment or r) • Are two variables related? • Car speed & likelihood of getting a ticket • Skinfolds & percent body fat • What happens to one variable when the other one changes? • Linear relationship between two variables • 1 measure of 2 separate variables or 2 measures of 1 variable • Provides support for a test’s validity and reliability
Scatterplot of correlation between pull-ups and chin-ups(direct relationship/+) Chin-ups (#completed) Pull-ups (#completed)
Scatterplot of correlation betweenbody weight and pull-ups(indirect/inverse relationship/-) Pull-ups (#completed) Weight (lb)
Correlation issues • Correlation ≠ causation • -1.00 < r < +1.00 • Coefficient of Determination (r2) (shared variance) • r=.70 r2=.49 49% variance in Y accounted for by X Y dv X iv
Negative correlation possibly due to: • Opposite scoring scales • True negative relationship • Linear or Curvilinear (≠ no relationship; fig 4.6) • Range Restriction (fig 4.7; ↓ r) • Prediction (relationship allows prediction to some degree) • Error of Prediction (for r ≠ 1.0) • Standard Error of Estimate (prediction error)
Limitations of r Figure 4.6 Curvilinear relationship Example of variable? Figure 4.7 Range restriction
Correlation & Prediction IREVIEW • Bivariate nature of correlations • X (iv) & Y (dv) • +/- relationships • Range of r? • Coefficient of Determination (r2) (shared variance) • Coefficient of variation (S/M): 2 data sets • Low V (.1-.2=homo): M accounts for most variability in scores • Curvilinear relationship? Fitness/PA • Correlation/Causation?
Uses of Correlation • Quantify RELIABILITY of a test/measure • Quantify VALIDITY of a test/measure • Understand nature/magnitude of bivariate relationship • Provide evidence to suggest possible causality
Misuses of Correlation • Implying cause/effect relationship • Over-emphasize strength of relationship due to “significant” r
Correlation and prediction % Fat Skinfolds
Sample Correlations Excel document
Standard Error of Estimate(SEE) Average error in the process of predicting Y from XStandard Deviation of error As r ↑, error ↓ As r ↓, error ↑ Is ↑r good? Why/Not? Is ↑ error good? Why/Not?