Download
1 / 13
130 likes | 516 Views
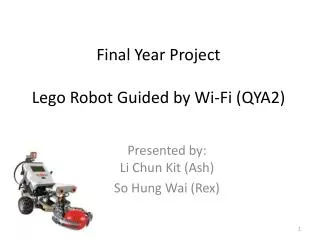
Final Year Project Lego Robot Guided by Wi-Fi (QYA2). Presented by: Li Chun Kit (Ash) So Hung Wai (Rex). Overview. Introduction Video Demo System Functions - Localization - Self-Guiding - Obstacles Detection - Auto Data Collection Conclusion Q&A. Introduction. Goals

E N D
Final Year ProjectLego Robot Guided by Wi-Fi (QYA2) Presented by:Li Chun Kit (Ash) So Hung Wai (Rex)
Overview • Introduction • Video Demo • System Functions- Localization- Self-Guiding - Obstacles Detection - Auto Data Collection • Conclusion • Q&A
Introduction • Goals • Wi-Fi Indoor localization • Self-Guiding • Lego robot as the media • to move and collect data • automatically Figure 1. The client-server architecture.
Localization Figure 3. Observed data received during online phrase. Machine Learning Algorithm Estimated Location Figure 2. Records in training database.
Localization : K-Nearest Neighbor (KNN) Classification by computing similarity between observed data and records in training database. For each record in database : K=10 K=4 Figure 4. For k=4, the user trace is classified to be grid c record; while it is classified to be grid a when k=10. The grid cell having the highest occurrence in the first k most similar records is the estimated location. a Euclidean Distance Records in grid a, band c b c
Localization: Bayesian Probability • Bayesian approach is based on signal strength distribution on each grid cell. • mitigates the random errors • adopts probability measurements Figure 5. A histogram showing the RSSI distribution of an access point at a grid cell • computes across 106 grid cells
Bayesian Probability Intuitively Figure 2. Records in training database.
Bayesian Probability In Practice Grid Cell 82 RSSI Profiles Grid Cell 83 RSSI Profiles
Appendix KNN Demonstration
Appendix Bayesian Formula