Download
1 / 5
50 likes | 189 Views
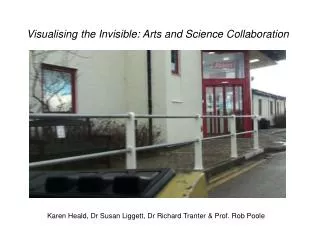
Dr. Pamela Mason, Strategy & Development Manager for the Creative and Performing Arts Team, highlights the vital role of digital technologies in the transformation of arts and humanities research. Emphasizing new methods for enhancing creativity and access, she advocates for collaboration beyond traditional boundaries. With tools like the Archaeology Data Service and Great Britain Historical GIS, this initiative seeks to empower researchers through innovative data visualization techniques. Effective visualizations not only reveal hidden trends but also foster public engagement and enrich the understanding of research outputs.

E N D
Visualising Data in the Arts and Humanities Dr Pamela Mason Strategy & Development Manager Creative and Performing Arts Team 24 January 2014
Digital Transformations • Exploit the potential of digital technologies to effect a transformation through incorporating and using the digital in arts and humanities research • Ensure that arts and humanities research is at the forefront of tackling crucial issues • Develop new ways of working to enhance access and creativity • Encourage new alliances in the arts and humanities and beyond • Develop new skills and techniques for working with data and technologies
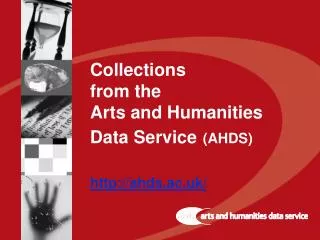
Arts and Humanities Data • Archaeology Data Service (ADS) preserves and supports archaeological data and its reuse http://archaeologydataservice.ac.uk/ • The Great Britain Historical (GBH) GIS holds 14,099,469 data values, bringing together historical surveys of Britain covering demographic, economic, social and political history over the last 200 years http://www.visionofbritain.org.uk/ • Digital images of musical scores, challenge of reading using Optical Music Recognition e.g. http://imslp.org/ • Time-based media data, such as music and film – includes camera-generated data as well as data generated through the creative process.
Why Visualisation? • Digital Arts can help create new types of interface and visualisation • Effective visualisations, as well as other representations of data (sound, hapticsetc) can add huge value to the data by: • Enabling new ways of communicating research • Exposing trends and insights that might otherwise have been missed • Allowing researchers to ask different questions of the data presented • Allowing popular access to the data
Gateway to Research? • Helping us to understand the Research Councils’ portfolios • Raising the profile of Research Council funded projects • Allowing easier public access to the information • Demonstrating the benefit of effective visualisations and the role of the Digital Arts • P.mason@ahrc.ac.uk