Understanding Statistical Studies and Data Collection Techniques
290 likes | 414 Views
Learn about experimental design, data collection methods, observational studies, experiments, simulations, and the importance of proper statistical analysis. Explore examples to understand data measurement levels.

Understanding Statistical Studies and Data Collection Techniques
E N D
Presentation Transcript
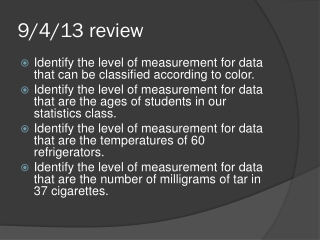
9/4/13 review • Identify the level of measurement for data that can be classified according to color. • Identify the level of measurement for data that are the ages of students in our statistics class. • Identify the level of measurement for data that are the temperatures of 60 refrigerators. • Identify the level of measurement for data that are the number of milligrams of tar in 37 cigarettes.
Unit 1.3 Experimental Design,Data collection, and sampling Techniques
Experimental Design • The goal of every statistical study is to collect data and then use the data to make a good decision. Any decision you make using the results of a statistical study is only as good as the process used to obtain the data. If the process is flawed, then the resulting decision is questionable. • You may never have to develop a statistical study (Just kidding – you have to do one for my class ) but it is likely that you will have to interpret the results of one. And before you interpret the results of a study, you should determine whether the results are valid.
To evaluate a study review these guidelines • Designing a statistical study • Identify the variable(s) of interest (the focus) and the population of the study. • Develop a detailed plan for collecting data. If you use a sample, make sure the sample is representative of the population. • Collect the data • Describe the data, using descriptive statistics techniques. • Interpret the data and make decisions about the population using inferential statistics. • Identify any possible errors.
Data Collection • There are several ways you can collect data. Often, the focus of the study dictates the best way to collect data. The following a 4 methods of data collection • Do an observational study • Perform an experiment • Use a simulation • Use a survey.
Observational Study • Researchers observe and measures characteristics of interest of part of a population. For example, an observational study was performed in which researchers observed and recorded the mouthing behavior on nonfood objects of children up to 3 years old.
Example of an Observational Study • The present study describes helping behavior of preschool children. 156 children between the ages of 18 and 76 months were observed 3 times for 10 min each, during their free play activity. The observers coded each helping act (whether it was performed in play or in reality) and noted its form (sharing, giving, aiding, and comforting), circumstances (self-initiation, compliance, and imitation), and condition (no promise of a reward, promise of social reward, promise of tangible reward and threat). The children were divided into 5 age groups. The results showed that, in general, helping behavior did not increase with age. But, with age, children performed fewer helping acts in imaginative play situations and more real helping acts. Also, with age, children performed more real comforting acts and fewer real giving acts. With regard to the other categories, no age differences were found.
Experiment • In an experiment, a treatment is applied to part of a population and responses are observed. For example, an experiment was performed in which diabetics took cinnamon extract daily while a control group took none. After 40 days, the diabetics who had the cinnamon reduced their risk of heart disease while the control group experienced no change. • Note: The difference between an observational study and an experiment is that in an observational study a researcher does not influence the responses whereas in an experiment a researcher deliberately applies a treatment before observing the responses.
Example of an Experiment • From about February 1942 to about April 1945, experiments were conducted at the Dachau concentration camp in order to investigate immunization for treatment of malaria. Healthy inmates were infected by mosquitoes or by injections of extracts of the mucous glands of female mosquitoes. After contracting the disease, the subjects were treated with various drugs to test their relative efficiency. Over 1,000 people were used in these experiments and more than half died as a result.
Simulation • A simulation is the use of a mathematical or physical model to reproduce the conditions of a situation or process. Collecting data often involves the use of computers. Simulations allow you to study situations that are impractical or even dangerous to create in real life, and often the save time and money. For examples, automobile manufactures use simulations with dummies to study the effect of crashes on humans.
Example of Simulation • National Transportation Safety Board officials say Asiana Flight 214 came in too slow and not high enough, leading to Saturday’s plane crash in San Francisco. • While investigators are still trying to figure out how and why this happened, aviation experts are recreating the deadly crash in simulators like one in Nashua, New Hampshire. • “We can do things in a simulator, we would never do in an airplane,” Steve Cunningham said.
Surveys • A survey is an investigation of one or more characteristics of a population. Most often, surveys are carried out on people by asking them questions. The most common types of surveys are done by interview, mail, or telephone. In designing a survey, it is important to word the questions so that they do not lead to biased results. Surveys can be used to take a census or a sampling. • A census is a count or measure of an entire population. Taking a census provides complete information, but it is often costly and difficult to perform. • A sampling is a count or measure of part of a population. For instance, every year the U.S. Census Bureau samples the U.S. Population to update the most recent census data. Using Samples is often more practical than taking a census.
Example of a Survey • AUSTIN (KXAN) - Depending on your point of view, a national survey published Tuesday has either staggering or sobering news for Austin. • According to the online Daily Beast, Texas' capital is the fifth drunkest city in the United States. Not as drunk as Boston, Norfolk, Va., Milwaukee and Charleston, S.C. • The publication ranked the top 25 using criteria like the average number of drinks downed per month by adults, the percentage of the population classified as "binge drinkers" and the percent of the population classified as heavy drinkers. • For Austin, the drinks-per-month figure was 14.6. The binge drinker percentage was 18.4 percent. And 5 percent of Austin's population was classified as heavy drinkers. • But those are lightweight stats compared with Boston. Drinks per month for the New England city averaged 15.6. More than 20 percent were binge drinkers and 7.4 percent was classified as heavy drinkers.
Deciding on Methods of Data Collection • Let’s consider the following statistical studies and decide which method of data collection would you use to collect data for each study? Explain your reasoning. • A study of the effect of changing flight patterns on the number of airplane accidents. • A study of the effects of aspirin on preventing heart attacks. • A study of how fourth grade students solve a puzzle. • A study of U.S. residents’ approval rating of the U.S. president.
Sampling Techniques • To collect unbiased data, a researcher must ensure that the sample is representative of the population. Appropriate sampling techniques must be used to ensure that inferences about the population are valid. Remember that when study is done with faulty data, the results will be questionable.
Random Sample • A random sample is one in which every member of the population has an equal chance of being selected.
Simple Random Sample • A simple random sample is a sample which every possible sample of the same size has the same chance of being selected. One way to collect a simple random sample is to assign a different number to each member of the population and then use a random number table. Responses, counts or measures from members of the population whose numbers than correspond to those generated using a table. Calculators and computer software programs are also used to generate random numbers. • When you choose members of a sample, you should also decide whether it is acceptable to have the same population member selected more than once.
With Replacement or Without Replacement • If it is acceptable, than the sampling process is said to be with replacement. If it is not acceptable, than the sampling process is said to be without replacement.
Stratified Sample • When it is important for the sample to have members from each segment of the population, you should use a stratified sample. Depending on the focus of the study, members of the population are divided into two or more subsets, called strata, that share a similar characteristic such as age, gender, ethnicity or even political preference. • A sample is then randomly selected from each of the strata.
Example • We want to collect a stratified sample of the number of people who live in Lago Vista households so we are going to divide the households in socioeconomic levels and then randomly select households from each level. High income Medium income Low income
Cluster Sample • When the population falls into naturally occurring subgroups, each having similar characteristics, a cluster sample may be the most appropriate. To select a cluster sample, divide the population into groups called clusters, and select all the members in one or more(but not all) of the clusters. • Examples of clusters could be different sections of the same course. Mrs. Bode’s 1st period Statistics class and her 3rd period Statistics class. • In using a cluster sample, care must be taken to ensure that all clusters have similar characteristics. For example, if one class has a higher proportion of Pre-AP and AP students data might not be representative of the population.
Systematic Sample • A systematic sample is a sample in which each member of the population is assigned a number. The members of the population are ordered in some way, a starting number is randomly selected, and then sample members are selected at regular intervals from the starting numbers. • For example , every 3rd or 5th one is selected. An advantage of this is that it is easy to use.
Biased Samples • A biased sample is one that is not representative of the population from which it is drawn. For instance, a sample consisting of only 18 to 22 year old University of Texas students would NOT be representative of the entire 18 to 22 year old population in the entire country. • A type of sample that often leads to biased studies ( so it is not recommended) is a convenience sample. A convenience sample consists only of available members of the population.
Real World Application • The Gallup Organization conducts many polls (or surveys) regarding the president, Congress and nonpolitical issues. A commonly cited Gallup poll is the public approval rating of the president. For example, the approval ratings for President George W. Bush from 2002 to 2004are shown in the graph. • What are some ways that Gallup could select a biased sample to conduct a poll? How could Gallup select a sample that is unbiased? Note: The rating is from the first poll conducted in January of each year.
Identifying Sampling Techniques • You are doing a study to determine the opinion of students at your school regarding gun control. Identify the sampling technique you are using if you select the samples listed. • You select a class at random and question each student in the class. • You divide the student population with respect to electives taken and randomly select and questions some students in each elective class. • You assign each student a number and generate random numbers. You then question each student whose number is randomly selected.
Uses and AbusesStatistics in the Real World • Uses • Surveys – Surveys can be valuable in determining the attitude of a population about a candidate, product, or issue. • If you are working for a political candidate, it is important that you know how the voting population views your candidate. With this information, you might be able to address voter concerns and increase your candidate’s chance of winning the election. • If you are working in the marketing research department of a manufacturing company, it is important that you know how the public will react to a proposed new product before the product is produced. Perhaps you will be able to alter the product’s design to make it more appealing and capture a greater market share. • If you are working for an activist organization, it is important that you know how the population feels about your organization’s issues. If you discover that the population does not support an issue, perhaps you will be able to change the public’s attitude through an advertising campaign.
Uses and AbusesStatistics in the Real World • Abuses • Biased Samples – The most common abuse ( or misuse) of statistics is using a sample that does not represent the entire population of the study. Consider a phone survey of opinions about a candidate for the Leander school board. The survey consisted of phone calls to numbers listed in the local phone directory of the 930 phone numbers dialed 543 were answered. Of the calls that were answered, 162 people agreed to take the survey. Of those surveyed 62% plan on voting for the candidate. • What can we conclude from this survey?
Uses and AbusesStatistics in the Real World • Abuses cont… • It should be clear that we CANNOT conclude from this survey that 62% of the voters in the locality plan on voting for the candidate. The survey did not include voters with unlisted numbers, or who did not happen to be at home, or who did not agree to participate in the phone survey. In such cases, we say that the survey is biased toward people who have listed phone numbers, tend to be home in the evening, and are willing to participate in surveys.
Uses and AbusesStatistics in the Real World • Abuses cont… • Biased Survey Questions – Another common abuse is using survey questions that encourage respondents, either intentionally or unintentionally, to answer in a certain way. For instance, consider a survey about gun control. It seems clear that the following questions would produce very different results. • “Do people have the right to own a gun to protect themselves and their families?” • “Do people have the right to possess loaded guns in their homes?”