Download
1 / 39
390 likes | 534 Views
Report to WMO Expert Team 2.2 on Climate Monitoring. Deke Arndt Chief, Climate Monitoring Branch NOAA’s National Climatic Data Center. First …. Jay Lawrimore sends his best regards. Action Item Reports. Tasked to NCDC / Jay at the initial meeting. A.5: Demonstrate Monitoring Resources.

E N D
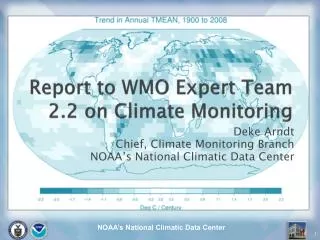
Report to WMO Expert Team 2.2 on Climate Monitoring Deke Arndt Chief, Climate Monitoring Branch NOAA’s National Climatic Data Center
First … • Jay Lawrimore sends his best regards
Action Item Reports Tasked to NCDC / Jay at the initial meeting
A.5: Demonstrate Monitoring Resources • To aid capacity-building, provide resources on the ET2.2 web site to demonstrate global monitoring efforts
A.12 – ET2.2 Pamphlet • Produce a pamphlet to support ET2.2 Outreach.
A.13 – Increase Understanding of BAMS SotC Document • Publish article to describe how BAMS SotC authorship is determined and how the document is published WMOBulletin57(2)
A.13 Result: Increased and Broader Participation in BAMS Document • Diamond: USA NOAA-NESDIS • Fogt: USA NOAA-NWS • Levy: USA NOAA-OAR • Richter-Menge, USA Army CoE • Thorne: UK Met Office • Vincent, Met Service of Canada • Watkins, Australia Bureau of Met • 2008 Chapter Editors diverse organizationally and internationally • Dealing with the “problems” of increased content now!
A.14 – Translate BAMS Document • Goal: Translate BAMSState of the Climate so that all six WMO languages are represented.
A.14 – Translate BAMS Document • Translations for 2008 document: • Abstract • Chapter Introductions • All figure captions
ECVs Added to BAMS SotC • ECVs reported in the Annual BAMS State of the Climate Report for 2008
Changes in global in situ data management • US CLIMAT messages • New GHCN version coming • Many internal improvements
Climate Monitoring Branch • Mission: “monitor and assess the state of the climate” • Products and information, not necessarily datasets • Near the end of the pipeline … lots of work upstream from us: • Data & Observing Systems Research • Product Development • Data Ingest • Quality Assurance • Also near the beginning of another pipeline. • Our work brings us into contact with stakeholders
State of the Climatehttp://www.ncdc.noaa.gov/sotc U.S. Report Global Report
SotC: Overview • Issued each month, season (DJF, MAM, JJA, SON) and year. • Each report (U.S. & Global) provides • Headlines • Narrative • Graphics • Insight into components of the climate system
SotC: U.S. Report … also • Drought • Wildfire • Severe Weather • Tropical Cyclones • Winter Weather
SotC: Global Report • Global Report assesses the global / regional behavior of: • Surface Temperature • Land, Ocean and Both • Precipitation • Sea Ice • ENSO (El Nino / La Nina) • Upper Atmospheric Temperature
New Climate Services Landscape • Reorganization of: • U.S. National Priorities • NOAA’s Climate Services function • NCDC’s organization chart • Means that the “Climate Monitoring” function is much more closely tied to Climate Service, as well as traditional ties to Climate Science
NOAA’s Climate Service Office • Will play out as NOAA’s climate services • May play out as a lead in a National Climate Service, should one occur • Several options/plans, based upon the Nation’s expressed needs/priorities • Strong focus on regional and sectoral issues
Monthly Online SotC is Changing • Now designed to be served out so others can incorporate components into their reports. • RSS feed, Portals • Includes much more educational / informational material • Incorporates much more content from local/regional climatologists • Beginning to add focus to events and impacts, not just variables
Global Hazards • Narrative reports of major climate-scale occurrences • Drought • Heat • Floods • Severe Weather • Tropical Cyclones • Winter Weather • By necessity, this product has many editorial decisions
U.S. Climate at a Glance Actual values (not just vs. normal) for any month, season, year since 1900. Tulsa Springs since 1948.
Global Climate at a Glance • Provides time series of trends in variables • Also make maps (this map is “How has JFM changed since 1900?”) • Can click on a dot to get the time-series for that dot.
Air Stagnation Index • Some impacts of air pollution: • reduced visibility, respiratory issues • Pollutant types: • Gaseous: ozone, SO2, NOXs • Particulates: soot, dust, smoke • ASI monitors stagnation component (buildup over time). • Does not monitor pollution sources. • Factors: • Light winds (low horiz. dispersion) • Stable lower atmosphere (prevents vertical escape) • Lack of precipitation (to cleanse lower atmosphere).
Heat Stress Index • How often does heat index exceed a threshold value at a particular station? • Values specific to the station’s overall climatology • (Texas will have a higher threshold than Maine)
Drought Monitoring • US Drought Monitor is an example of cross-community climate services • Ag + Water + etc. experts • Climatologists • US Drought Portal brings communities together around a phenomenon • http://www.drought.gov • Expressed needs: air quality issues and heat waves associated with drought.
North American Drought Monitor • Joint effort: Canada, Mexico and the U.S. • Part of extended Canada-U.S. GEO collaboration • NADM Workshop: April 2010, Asheville, NC, USA. To explore international drought issues beyond North America
Climate Extremes Index (CEI) • CEI = five indicators illustrate extremes in: • monthly mean maximum and minimum temperature • extreme 1-day precipitation • the number of days with/without precipitation • the Palmer Drought Severity Index (PDSI) • Area of the CONUS with extreme conditions is compared with the remainder of the CONUS to yield a fraction for a given period
CEI: National • Notable upward CEI trend from 1970 to present • Mostly from max and min temps, 1-day precipitation and PDSI (drought)
CEI: Slightly finer resolution • CEI Annual Seasonal • Recently added a tropical system component, calculated for multiple seasons • Additions and modifications are explained in “A Revised U.S. Climate Extremes Index” (Gleason et al. 2008) • Underway: pilot project for southeast US. If successful, more regional applications expected.
N. American Climate Extremes Monitoring (NACEM) • Designed to capture status and changes of extreme and threshold behavior of the climate system • How often does something happen? • Is the frequency changing?
Thank you for your time I wish you continued success Deke Arndt Derek.Arndt@noaa.gov