Designing for Performance: Key Strategies for .NET Development Success
Join Vance Morrison, Performance Architect of the .NET Runtime Team, as he explores essential strategies for effective performance design in .NET applications. This talk aims to motivate developers to prioritize performance throughout the development cycle, specifically during the initial design stages. Learn about the best practices, tools, and frameworks for understanding performance metrics. Discover how to integrate performance planning into all projects and why you must measure and care about performance from design to servicing. Remember, performance is a critical aspect—plan for it!

Designing for Performance: Key Strategies for .NET Development Success
E N D
Presentation Transcript
Designing For Performance (For .NET) Vance Morrison Performance Architect .NET Runtime Team
Goals of Talk • Motivate doing perf during development • Encourage best practices especially at design time • Show you the best available tools • Provide a framework for understanding Perf • Talk meant to be a ‘Survey Course’ • Lots of links for more information • If you remember only one thing • Vance Morrison's Weblog
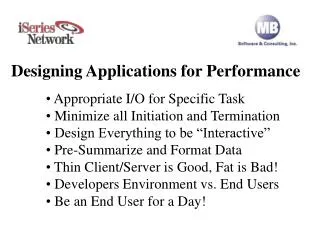
To Design for High Performance • Care about Performance • Performance IS extra work, schedule for it • You must know what performance you care bout • You must PLAN for performance from Design to Servicing • Measure, Measure, Measure • You will be measuring in ALL parts of the release cycle • Often neglected early in the product cycle • Can also loose perf anywhere along the way (even servicing).
Talk Outline • Perf Early in Design: Planning and Design • Perf Theory: What’s Important and Why • Perf Practice: Measuring Tools
Performance Planning • ALL projects should have a performance plan • Performance plans CAN be easy • Start with your most important User Scenarios • e.g. Startup, various response times. • Articulate what is Bad, Good and Excellent Perf • e.g. Startup 10 sec bad, 3 sec Good, < 1 sec Excellent • Coarse Estimate if ‘Good Perf’ is in Jeopardy • Uncertainty => more prototyping and measurement • Bad Perf => design change Followup: CLR Inside Out: Measure Early and Often for Performance, Part 1
Importance of Design Time • Most performance is lost during initial design • Design perf loss can’t be fixed easily • Guiding Principle: Pay For Play • Users should not pay for what they don’t use • Lay groundwork for better perf in V2 • Need to know what things cost to do design • Getting data from references / past experience • Doing experiments to gather needed data Followup: Perf data on .NET primitive operations: CLR Inside Out: Measure Early and Often for Performance, Part 2
If You Want Perf, You MUST Design for It Examples of What happens when you Don’t Care • NotePad.exe vs Browse.exe • Notepad maps whole file into memory, scans it => Notepad is unusable on files > 100 Meg • IE as XmlViewervsXmlView • IE maps XML into DOM, XMLView keeps pointers => IE is unusable on XML files > 50 Meg • XmlDocumentvsXmlReader • XmlDocument reads whole document into memory • unusable on XML files > 50 Meg • MS Manager Review Tool • Downloaded 50 Meg into an In Memory Database Cache => Long startup times, Large working sets, sluggishness because of paging
Talk Outline • Perf Early in Design: Planning and Design • Perf Theory: What’s Important and Why • Perf Practice: Measuring Tools
What Should You Measure? • Lots to choose from • OS METRICS: %CPU, User Time, System Time, Working Set, Private Working Set, Commit Size, Page Faults, I/O Counts, Bytes Read,, Cache misses, Branch Mispredicts, TLB misses, Interupts, Context Switches, Registry Access, File Access, DLLs loaded, Thread Count, … • .NET METRICS: Methods Jit compiled, IL Size compiled, % Time in JIT, # GCs, GC Memory Alloced, GC Heap Size, % Time in GC, #Exceptions, #Contentions, # CCWs, # Transitions, • Other METRICS Groups: IE, SQL Server, ASP.NET, WPF, IPSec, TCP/IP, … • Simplify: You really care about TIME • You only care about other metrics to the extent that they affect the TIME of interest • TIME is the ‘currency’ for making tradeoffs
Taxonomy of a Perf Investigation • Determine Interval of Time Of Interest • Startup Time, Response Time, Throughput (Time for batch of work), … • Determine the Critical Path • If there is any concurrency, you only care about longest sequential Path • Minimize Critical Path Time • Do less work • Do work more efficiently (less expensive operations) • Move work off critical path (use multiple threads) ASynchronous I/O Synchronous I/O Disk Read Buff … Process … Disk Read 1ms 1us 2ms 1ms Buff Process … Critical Path 3 ms 1us 2ms Critical Path 2.001 ms
Minimizing Critical Path Time What Can a Single Thread Be Doing? • CPU (Executing Instructions) • Blocked (Waiting For Something else) • Disk (Fetching persistent Data) • Network (Waiting on Cross-Machine Resources) • Event/Locks (Waiting on other Threads (e.g. SQL DB)) Concentrate optimization on the biggest items • Easy to only worry about CPU, Think about blocked time too! • Critical path can change to another thread
Blocked Time:Events/Locks • Client programs typically don’t have problems here • Client programs tend to be sequential • Some other thread is doing work while main thread waits. • For parallel (server) workloads, can be a big issue • Several threads can be blocked waiting for event/lock • ‘Hot Locks’ are most common reason for poor scaling. • Symptom is that CPU is not being consumed fully. • The best way to solve scaling problem by sharing less between threads. • Read-only data is much cheaper (memory system makes copies) • Update in place is generally bad. Functional style good.
Blocked Time: Network • Network slower than Disk (> 10 msec round trip) • Many Apps don’t have any network cost (good) • If yours does, however, manage it carefully • Design should optimize to minimize round trips • Synchronous waits on network are particularly bad
Blocked Time: Disk • Disk is 10,000 X slower than RAM. • 4-8 msec to seek, 20Msec / Meg to transfer • Disk time Dominates on ‘Cold Startup’ (page faults) • OS caches disk data, so ‘Warm Startup’ uses no disk • Cold times of 10sec or > are not uncommon • To improve Disk time • Run less code at startup (and load fewer DLLs) • Pack the data you do bring in from disk • Unmanaged code use Profile-Guided Optimization • Nothing for managed code (yet) • Use less .NET Reflection (harder to pack well) Follow up: Vance Morrison's Weblog : A model for cold startup time Track down DLL loading using Visual Studio
CPU Time Optimization • CPU cost breaks down as • Time to execute the instructions (often 1 cycle or less) • Time used to fetch arguments (can be many cycles) • Improve CPU by • Executing fewer instructions (better algorithms) • Keeping args in cache (making structures / code smaller) • If CPU used by .NET GC • If GC uses > 10% CPU, GC Heap needs tuning • To improve, allocate less, avoid ‘long lifetimes that die’ • IF CPU used by .NET JIT Compiler • Use NGEN to pre-compile the .NET code Followup: Garbage Collector Basics and Performance Hints Maoni Stephens's WebLog Speed: NGen Revs Up Your Performance with Powerful New Features
Why / When Memory is Important • Memory is not a primary metric (Time is) • Important when it affects time • Code size affects startup (page faults), and task switching • Data size affects CPU Cache, which affects CPU Time • Heap size affects .NET GC • Memory your app uses ‘steals’ memory from other applications • Some memory more important than other memory • Read only Memory (Code) can be shared across processes is less ‘expensive’ if it is actually shared (OS dlls etc) • ‘Private’ (Heap, or GC Heap) memory is more expensive Follow up: Memory Usage Auditing for .NET Applications
Talk Outline • Perf Early in Design: Planning and Design • Perf Theory: What’s Important and Why • Perf Practice: Measuring Tools
Monitoring Tools • Task Manager (start taskmgr.exe) • Built into Windows • Monitors at process granularity • Resource Monitor a very useful addition • Process Explorer(free) more feature rich option • Performance Counters (start PerfMon.exe) • Also built into windows • Also monitors at process granularity • A large number of counters available • Eg: .NET Memory # Gen0, #Gen1, #Gen2, Bytes In All Heaps • Designed for long-lived (server) process monitoring
Event Tracing For Windows (ETW) • An high performance logging infrastructure • Kernel, .NET already support it • In Vista+ Supports Stack traces on kernel events. • Important Events • Process Start End, Thread Start End, DLL Load, Unload • 1 MSec Sampling per CPU • Thread Context Switch • Page Faults (Soft faults, Hard Faults), VirtualAlloc Calls • Disk I/O • File System Access, Registry Access • ReadyThread (what makes a thread runable) • .NET Thread Pool, GC, Module Loads, Appdomains, … Further Reading: Event Tracing: Improve Debugging And Performance Tuning With ETW Core OS Events in Windows 7, Part 1 Core Instrumentation Events in Windows 7, Part 2
CPU Measurement • Instrumentation based profiling • Modify code to add logging on method entry and exit • Requires modification of code, will affect memory cache behavior • Can slow the program substantially • CLRProfiler and some Visual Studio profiling work this way • Sample based profiling • Stop processor and crawl stack every on a given interval (e.g. 1 msec) • Assign the full 1msec to wherever the sample was taken • Efficient (< 5% overhead), dialable, non-intrusive • Sampling ‘noise’, Need 10 samples in interval to start to be meaningful • ETW CPU profiling is sample based. Other events are instrumentation
Investigation Tools • XPERF Windows Performance Analyzer (WPA) - Free Microsoft Download • Collects and Visualizes ETW logs (ETL files) • Vista and above. Can collect stacks for system events • Fixed, 1 MSec sampling for CPU • Symbolic resolution for unmanaged stacks • Currently does not support symbolic stacks for managed code • Visual Studio 2008 Profiler (Visual Studio Team System) • Works on .NET code or unmanaged • Can do Sample based, Instrumentation Based profiling • Sample based profiling only does user mode CPU profiling • Sample based profiling can sample other useful CPU investigation metrics (cache misses, mispredicts …) • Visual Studio 2010 Parallel Performance Analyzer(ETW based) • Shows all threads, and what they are doing (CPU, Disk, Blocked) • Allows you to determine which threads unblocked a blocked thread (what was it waiting for) • VMMap - Free Microsoft Download • shows coarse memory usage of a single process. • Useful for seeing whether unnecessary DLLs loaded, • ClrProfiler- Free Microsoft Download • shows fine grained usage of .NET GC heap
Investigation Technique Understand your Critical path, and the resource that constrains you • Visual Studio 2010 Parallel Performance Analyzer • Xperf Based on the critical resource, you can drill down with other tools • CPU • Visual Studio 2010 Parallel Performance Analyzer • Visual Studio 2008 Profiler (Visual Studio Team System) • XPerf • Disk • Visual Studio 2010 Parallel Performance Analyzer • XPerf • Blocked / Network • Visual Studio 2010 Parallel Performance Analyzer Measuring Memory • VMMap - shows coarse memory usage of a single process. • ClrProfiler– shows fine grained usage of .NET GC heap
Links and More Links • Articles • CLR Inside Out: Measure Early and Often for Performance, Part 1 • CLR Inside Out: Measure Early and Often for Performance, Part 2 • Memory Usage Auditing for .NET Applications • Blogs • Vance Morrison's Weblog • Windows Performance Analysis Developer Center (not really a blog, but has FAQ and links to other blogs …) • CLR and Framework Perf Blog (.NET Runtime’s Performance Team notes on Performance) • Rico Mariani's Performance Tidbits • Visual Studio Profiler Team Blog • HazimShafi's Blog (details on VS 2010 new Performance tools) • Pigs Can Fly : Xperf, a new tool in the Windows SDK • Tools • MeasureIt(Benchmarking tool for design time) • Visual Studio 2008 Profiler (Part of Visual Studio Team System) General CPU profiling • Visual Studio 2010 Parallel Performance Analyzer (Part of Visual Studio Team System) Good all-round profiling (CPU, Disk, Blocked) • Windows Performance Analyzer (WPA) (XPERF), General Sub-process performance analysis. • VMMap (Measuring the coarse memory usage within a process) • CLR Profiler for the .NET Framework 2.0 (Measuring detailed memory usage within the GC heap) • Process Explorer (A more feature-rich Task Manager) • Process Monitor (A tool for monitoring • Event Tracing Windows (ETW) Articles • Event Tracing: Improve Debugging And Performance Tuning With ETW • Core OS Events in Windows 7, Part 1 • Core Instrumentation Events in Windows 7, Part 2
Review • FOLLOW UP • Slides at Vance Morrison's Weblog follow links • CARE ABOUT PERF (especially at design time) • Understand the scenarios that are performance critical, set Goals. • Estimate Perf at Design time, Experiment to reduce uncertainty • MEASURE, MEASURE, MEASURE • You care about TIME • Understand how other metrics affect TIME • Invest in understanding your tools and metrics. • Don’t stop measuring (go all the way through servicing)