Download
1 / 41
410 likes | 427 Views
This presentation discusses the application of the Tunnelling Quality Index (TQI) for the construction of large underground caverns in lift irrigation projects. It covers the assessment of tunnel quality, geomechanics classification, determination of Hoek-Brown parameters, estimation of support pressure, recommendation of support system, and evaluation of support system efficacy.

E N D
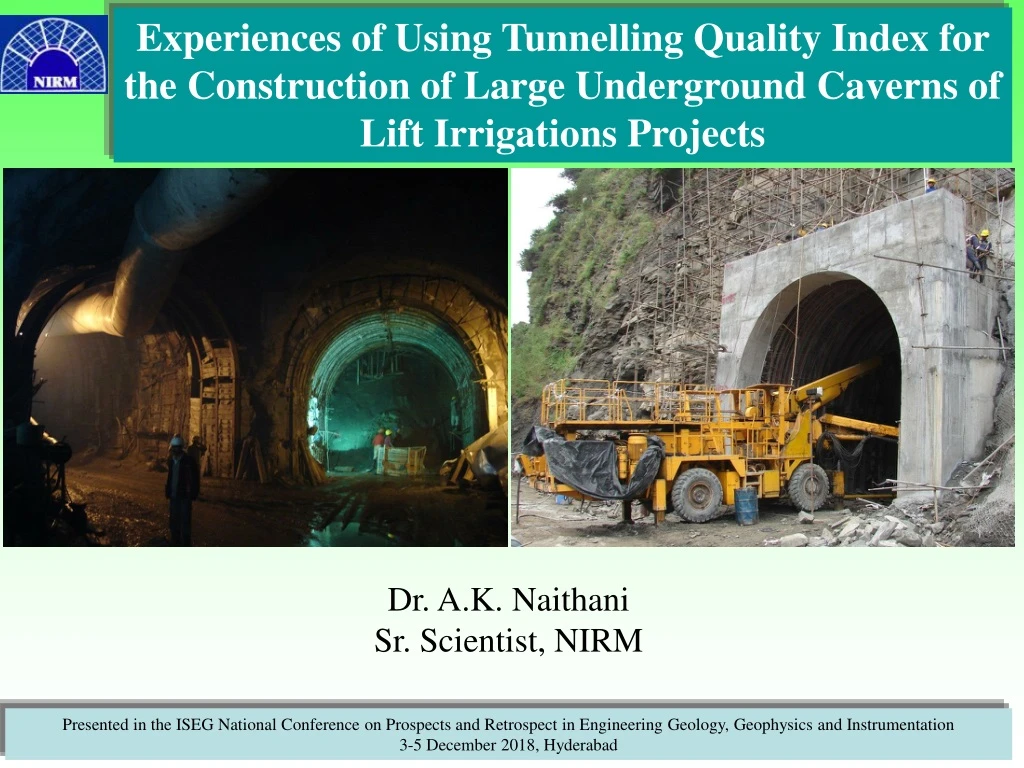
Experiences of Using Tunnelling Quality Index for the Construction of Large Underground Caverns of Lift Irrigations Projects Dr. A.K. Naithani Sr. Scientist, NIRM Presented in the ISEG National Conference on Prospects and Retrospect in Engineering Geology, Geophysics and Instrumentation 3-5 December 2018, Hyderabad
ENGINEERING GEOLOGY DEPARTMENT Purpose of Construction • To cater the needs of irrigation in the drought prone upland. • Also to provide drinking water to villages & towns onroute, industries. • The major lift irrigation schemes are: • Mahatma Gandhi Kalwakurthi Lift Irrigation Scheme (MGKLIS) • Kaleshwaram-DBRAPCSS Link-II Lift Irrigation Scheme (KLIS) • PalamuruRanga Reddy lift irrigation scheme (PRLIS).
ENGINEERING GEOLOGY DEPARTMENT MGKLIS is constructed in three stages for lifting the Krishna water from Srisailam reservoir (back water) to Gudipallygattu balancing reservoir. This project envisages to irrigate about 3,40,000 acres uplands.
ENGINEERING GEOLOGY DEPARTMENT KLIS-II – Plan & Elevation Schematic Drawing
ENGINEERING GEOLOGY DEPARTMENT KLIS is being constructed having the 19 lifts to cater to the needs of irrigation in the drought prone upland areas by drawing and lifting 160 thousand million cubic feet (TMC ft) of water from River Pranahitha through tunnels and gravity canals, and also to provide drinking water to villages and towns enroute. The project envisages irrigation of about 16,40,000 acres of uplands and the total lift height will be 488 meters. All the works are divided into 28 Packages. An Overview of Kaleshwaram-DBRAPCSS Link-II Lift Irrigation Scheme
ENGINEERING GEOLOGY DEPARTMENT Chevella Reservoir System of KLIS By Gravity Tipparam Tadkapally +535.00 M +530.00 M Imamabad +480.00 M Ananthagiri +390.00 M Into Kakatiya canal By Gravity Mothevagu Mid Manair +318.00 M +318.00 M Medaram +235.83 M Yellampally +148.00 M Pranahita
ENGINEERING GEOLOGY DEPARTMENT Layout Map of KLIS -P6
ENGINEERING GEOLOGY DEPARTMENT Palamuru-Ranga Reddy Lift Irrigation Scheme (PRLIS) • PRLIS is being constructed to cater to the needs of irrigation in the drought prone upland areas of Mahabubnagar, Rangareddy and Nalgonda districts by drawing and lifting 90 TMC of water from foreshore of Srisailam reservoir through tunnels and gravity canals, and also to provide drinking water to villages and towns enroute. • PRLIS is being constructed having the five stage of lifts (I, II, III, IV and V) from Srisailam reservoir (FRL +269.735 m) to K.P. Lakshmidevipalli reservoir (FRL +670 m). • Total length of approach channel 63.875 km. Total length of tunnel 47.866 km. Total lift height 400 m. • The pump house complex of Lift –II comprises a pump house, a surge pool, draft tube tunnels (10 nos.), emergency exit tunnel, permanent access tunnels (2 nos.) on the either side of the pump house, ventilation duct tunnels (2 nos.), adit tunnels, two maintenance bays, annex building, delivery mains (10 nos.) and delivery cistern. • New Reservoir – 8 nos.
ENGINEERING GEOLOGY DEPARTMENT Content of the Presentation • Assessment of Tunnel Quality Index ‘Q’. • Geomechanics Classification for the rock mass. • Determination of Hoek-Brown parameters by the statistical analysis of the results of a set of triaxial tests on core samples. • Estimation of support pressure and ground squeezing condition. • Recommendation of support system on the basis of geological characteristics and NMT. • Evaluation of efficacy of the support system.
ENGINEERING GEOLOGY DEPARTMENT Application of the Characterization of Rock Mass for Large Cavern (Heading Portion) • For predicting geologic conditions in benching down up to invert level. • Planning support system. • Selecting inclination for best location of supplemental rock bolt. • Choosing strategic locations for various types of instrumentation.
ENGINEERING GEOLOGY DEPARTMENT 3D Geological Map
Rock mass classifications form the backbone of the empirical design approach and are widely employed in rock engineering. ENGINEERING GEOLOGY DEPARTMENT ROCK MASS CLASSIFICATIONS Q-System Some Background • There has been a significant advance within support philosophy and technology in underground excavations since the introduction of the Q-system in 1974. • After its introduction in 1974, two revisions of the support chart have been carried out. • On the basis of 1050 examples mainly from Norwegian underground excavations an extensive updating was done in 1993 (Grimstad and Barton, 1993). • Based on more than 900 new examples from underground excavations in Norway, Switzerland and India, an updating was made in 2002. • This update also included analytical research with respect to the thickness, spacing and reinforcement of reinforced ribs of sprayed concrete (RRS) as a function of the load and the mass quality (Grimstad et al. 2002).
ENGINEERING GEOLOGY DEPARTMENT Norwegian Tunneling Method The Q system is based on numerical assessment of the rock mass quality using six different parameters. These six parameters are grouped into three quotients to give the overall rock mass quality Q. Where: RQD = Rock Quality Designation, Jn = Number of joint sets, Jr = Joint roughness number, Ja = Joint alteration number, Jw = Joint water reduction number, SRF=Stress Reduction Factor. The rock quality can range from Q = 0.001 to Q = 1000 on a logarithmic rock mass quality scale.
ENGINEERING GEOLOGY DEPARTMENT Geomechanics Classification (Rock Mass Rating System) • RMR system was developed by Bieniawski in 1973 and it was modified over the years as more case histories became available and also to conform with international standards and procedures. • To following six parameters are used to classify a rock mass • Uniaxial compressive strength of rock material • Rock quality designation (RQD) • Spacing of discontinuities • Condition of discontinuities • Groundwater conditions • Orientation of discontinuities Rock Mass Rating (RMR) 1973 – based upon 49 tunnels 1984 – 62 coal mining projects 1987 – 78 tunnelling and mining case histories 1989 – based upon 351 civil engineering and mining case histories
ENGINEERING GEOLOGY DEPARTMENT Hoek-Brown Parameters • In order to use the Hoek-Brown criterion for estimating the strength and deformability of jointed rock masses, following parameters have been estimated: • The value of the Geological Strength Index (GSI) for the rock mass • The uniaxial compressive strength (σci) of the intact rock pieces and • The value of Hoek-Brown constant (mi) for these intact rock pieces. • Geological Strength Index (GSI) was introduced by Hoek and Brown (1997) to provide a system for estimating the reduction in the rock mass strength for different geological conditions. The GSI can be related to the rock mass rating (RMR) or the modified rock-mass quality index (Q’).
ENGINEERING GEOLOGY DEPARTMENT Hoek and Brown (1997) suggested that GSI can be related to Q’ and RMR by following equations. Bieniawski’s RMR classification should be used for estimating GSI values for better rock masses (GSI > 25) and should not be used for poor quality rock masses.
ENGINEERING GEOLOGY DEPARTMENT • The values of σci and mi were determined by the statistical analysis of the results of a set of triaxial tests on core samples. • After obtaining the test results, they were analysed to determine the uniaxial compressive strength (σci) of the intact rock pieces, and the value of Hoek-Brown constant (mi) as described by Hoek and Brown (1980).
ENGINEERING GEOLOGY DEPARTMENT • For each sample the uniaxial compressive strength (σci), the constant (mi) and coefficient of determination (r2) are calculated. The Hoek – Brown parameters that describe the rock mass strength characteristics can be derived from GSI. Where: mb is the value of the Hoek-Brown constant for the rock mass and mi is the Hoek-Brown constant for the intact rock.
ENGINEERING GEOLOGY DEPARTMENT • Hoek-Brown constants ‘s’ and ‘a’ are depend upon the rock mass characteristics. For GSI > 25, i.e. rock masses of good to reasonable quality, the original Hoek-Brown criterion is applied with (eq 10 & 11). The rock mass strength can be characterized by a GSI value of 55 (fair category), which was used to establish the parameters (mb, s, a etc) required for the Hoek-Brown failure criterion. The constants ‘s’ and ‘a’ calculated are 0.0067 and 0.5 respectively.
ENGINEERING GEOLOGY DEPARTMENT Estimation of Support Pressure and Ground Squeezing Condition • In this study roof support and wall support pressure was estimated as per equations 14 and 15, which is applicable for the non-squeezing ground condition (Singh et al. 1992, IS 13365 Part 2, 1992). ) Where; Proof is permanent/ultimate roof support pressure in kg/cm2, Pwall is ultimate wall support pressure in kg/cm2, Jr is joint roughness number, Q is rock mass quality, Qw is wall quality/factor equal to 5 Q for better qualities rock mass (Q > 10) and 2.5 Q for intermediate qualities (0.1 < Q < 10), Jn is joint set number and f is correction factor for overburden.
ENGINEERING GEOLOGY DEPARTMENT Correction factor (f) for overburden can be estimated. • Where H is the height of overburden above crown in metres • Singh et al. (1992) suggested an empirical approach (eq. 17) based on case histories and by collecting Barton et al. (1974) ‘Q’ data and overburden (H) for the estimation of non-squeezing ground condition. Minimum Q-value is used for the estimation of ground squeezing condition.
ENGINEERING GEOLOGY DEPARTMENT Support Design – Summary of Input Data
ENGINEERING GEOLOGY DEPARTMENT • The permanent support estimate is based on: • The rock mass quality Q • The support pressure • The equivalent dimension and • purpose of the excavation. Bolt lengths depend on the dimensions of excavations and the length of rock bolts can be estimated from the excavation span (B) or height (H) and the excavation support ratio (ESR) (Barton, et al. 1974 & 1980). • Where Lroof/walls are bolt length in metres for roof and walls, B is span in metres, H is excavation height in metres and ESR is excavation support ratio. • The Norwegian Institute for Rock Blasting Technique has proposed a formula to estimate the length of the bolts in the central section of the opening (Stillborg, 1994). Where B is the span of the opening in metres.
ENGINEERING GEOLOGY DEPARTMENT The thickness of steel fibre reinforced shotcrete can be estimated as per equation (eq. 21) (Singh et al. 1995, Singh and Goel, 2011, IS 15026, 2002). • Where: • tfsc is thickness of SFRS lining • Proof is ultimate roof/wall support pressure • B is size of opening • Ffsc is mobilization factor for shotcrete (0.6±0.05) and • qfsc is shear strength of fibre reinforced shotcrete (550 t/m2)
ENGINEERING GEOLOGY DEPARTMENT Estimation of Support System Capacity The capacity of support system consisting of SFRS, rock bolt and grouted arch/rock column is determine using the integrated approach given by Singh et al. (1995), Singh and Goel (2011) and IS: 15026 (2002). The total support pressure (u + proof/wall) will be equal to the sum of capacities of support system (eq. 22). • Where • u = seepage water pressure (t/m2 • proof = roof support pressure (t/m2) • pwall= wall support pressure (t/m2) • psc = capacity of SFRS (t/m2) • pbolt = capacity of rock bolts (t/m2) • pgt = capacity of grouted arch/rock column (t/m2)
ENGINEERING GEOLOGY DEPARTMENT The capacity of SFRS as estimated (eq. 23) for roof and walls is 13.61 t/m2 and 6.27 t/m2 respectively. • Where • psc = capacity of SFRS lining (t/m2) • qfsc = shear strength of SFRS (550 t/m2) • tfsc = thickness of SFRS (m) • B = size of opening (m) • Ffsc = mobilization factor for shotcrete (0.6±0.05 – higher for cavern)
ENGINEERING GEOLOGY DEPARTMENT The capacity of rock bolt is estimated (eq. 24) and the minimum capacity for roof and surge pit walls calculated is 1.577 t/m2, and 0.349 t/m2 respectively. Where pbolt = capacity of rock bolt (t/m2) qcrm = UCS of reinforced rock mass (t/m2) (eq. 25) l' = thickness of reinforced rock arch/rock column (m) (eqs. 26 & 27) 2θ = 90° B = size of opening (m) Fs = mobilization factor for rock bolts
ENGINEERING GEOLOGY DEPARTMENT Singh et al. (1995) proposed mobilization factors after back analysis of Barton et al. (1974) support systems case studies. For rock bolt mobilization factors (Fs) are calculated from equations 28 and 29 for roof and walls respectively. For roof Fs values are varying from 3.996 to 4.181 while for walls values are ranging between 3.787 and 4.056.
ENGINEERING GEOLOGY DEPARTMENT The capacity of grouted rock arch/rock column is calculated by the equation 30. The minimum grouted arch/rock column capacity for roof and surge pit walls calculated is 2.650 t/m2 and 0.492 t/m2 respectively. Where pgt = capacity of grouted arch/rock column (t/m2) qgt = UCS of grouted rock mass (t/m2) lgt = thickness of grouted arch/rock column (m) B = size of opening (m) Fs = mobilization factor for grouted arch/rock column For grouted arch/rock column mobilization factors (Fgt) are calculated from equations 31 and 32 for roof and walls respectively. For roof Fgt values are varying from 3.932 to 4.610 while for walls values are ranging between 4.376 and 5.564.
ENGINEERING GEOLOGY DEPARTMENT Conclusions • Many underground caverns of lift irrigation projects are being constructed in Telangana State are largest in the world, so it is recommended that proper review of real time engineering geological investigation work should be done and accordingly support system can be modified during the review process. • By doing this life of the structure can be increased. • Tunnel Quality Index can be used for the support design of caverns.
THANK YOU NIRM