Download
1 / 23
230 likes | 312 Views
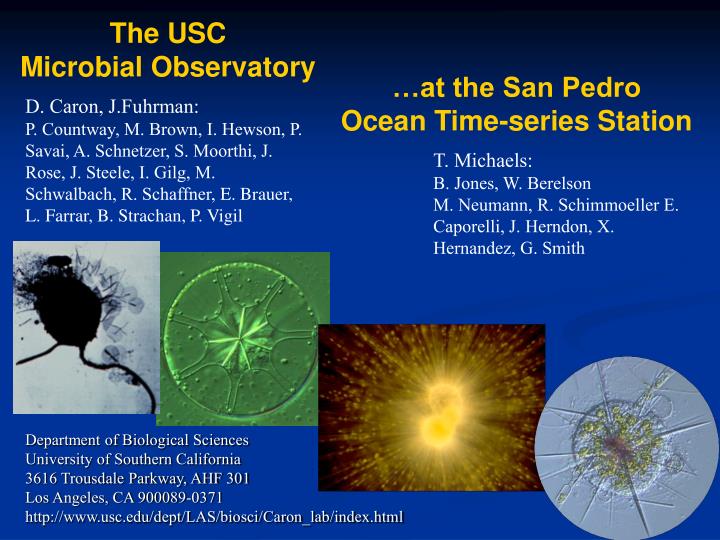
The USC Microbial Observatory. …at the San Pedro Ocean Time-series Station. D. Caron, J.Fuhrman: P. Countway, M. Brown, I. Hewson, P. Savai, A. Schnetzer, S. Moorthi, J. Rose, J. Steele, I. Gilg, M. Schwalbach, R. Schaffner, E. Brauer, L. Farrar, B. Strachan, P. Vigil. T. Michaels:

E N D
The USC Microbial Observatory …at the San Pedro Ocean Time-series Station D. Caron, J.Fuhrman: P. Countway, M. Brown, I. Hewson, P. Savai, A. Schnetzer, S. Moorthi, J. Rose, J. Steele, I. Gilg, M. Schwalbach, R. Schaffner, E. Brauer, L. Farrar, B. Strachan, P. Vigil T. Michaels: B. Jones, W. Berelson M. Neumann, R. Schimmoeller E. Caporelli, J. Herndon, X. Hernandez, G. Smith Department of Biological Sciences University of Southern California 3616 Trousdale Parkway, AHF 301 Los Angeles, CA 900089-0371 http://www.usc.edu/dept/LAS/biosci/Caron_lab/index.html
The USC M.O. Broad Objectives/Directions Prokaryote and Eukaryote Discovery Diversity: Short and Long(ish) Time Scales Characterizing Distributions Defining Relationships among Microbial Taxa Autecological studies
USC Microbial Observatory and San Pedro Ocean Time Series N 20 km
Temperature °C Nitrate (µM) Phosphate (µM) http://wrigley.usc.edu/data_sys/
Silicate (µM) Chlorophyll Oxygen (ml/l)
USC Microbial Observatory and San Pedro Ocean Time Series Temperature Oxygen Chlorophyll a Bacteria by FCM by EFM Viruses by EFM (SYBR Green) Sept 2000 Dec 2003
USC Microbial Observatory and San Pedro Ocean Time Series Prochlorococcus FCM Synechococcus FCM Picoeukaryotes FCM Aloricate ciliates Dinoflagellates Diatoms Sept Dec 2000 2003
Whole Bacterial Community Fingerprints Amplified Ribosomal Intergenic Spacer Analysis (ARISA) backed by Clone Libraries for ID. Phylogenetic resolution near “species” level ARISA PCR primers ARISA PCR Fluorochrome 16S rRNA gene 23S rRNA gene Intergenic Spacer, Variable Length Run products on a fragment analyzer. Each peak represents an “Operational Taxonomic Unit.” Reference: Fisher and Triplett 1999, others... PCR from these primers to make Clone Libraries to identify ARISA OTUs 16S sequence provides ID, ITS sequence provides length and very high resolution phylogenetic information (ca. “strain” level).
SAR11 cluster (in San Pedro Channel) Microdiversity - The rule rather than the exception. ITS shows clusters well. Populations are not clonal. 16S ITS 0.1 SAR 11 cluster alone - we estimate ~800 distinguishable sequence types at our coastal study site (Chao 1)- clustered into ~10 groups (ecotypes?) 284 clones 138 from SPOTS 0.1
Annual Bacterial Community Reassembly with Shahid Naeem, Columbia University Discriminant Function Analysis ‘Clockfaces’ - Months are like hours on the clock. Radii represent discriminant function of taxa (a function of community composition). Central line: mean Dashed lines: range over 3 years Chl max 1-50 51-100 100-150 ARISA Bins
T-RFLP Eukaryote Seasonal Pattern USC M.O.HaeIII Digest Typically 40-70 fragments/sample. Important tool for Correlating to ARISAs (prokaryote community structure)
Bacterial - Protistan Relationships Bacterial OTU 643 640 646 517 940 607 e76 e135 e129 e500 e276 e302 e362 e335 e481 e130 e73 e74 765 705 e131 e281 475 526 800 478 559 682 e230 655 e126 e502 e198 e182 e272 e493 e496 e341 0.1 e338 e498 e485 e488 e597 547 619 770 487 e233 1030 e192 855 e589 610 631 508 532 790 592 805 740 985 1180 538 529 e268 e492 e179 e177 e301 760 e262 e454 e459 e602 481 835 e68 691 e94 e231 e61 e504 571 795 e237 e487 433 649 685 745 850 785 885 e282 700 e325 e327 e196 e195 e331 e228 e402 661 664 1050 568 e501 628 e175 400 424 421 0.1 e128 652 e300 472 715 725 775 418 676 679 755 825 469 e261 e324 e598 e451 e600 e603 613 e503 493 e224 e453 e595 905 e274 e336 e340 e497 960 e275 e450 e591 541 625 e181 945 e132 e136 e229 520 616 780 e346 667 e283 e333 e232 710 e332 e236 e234 e486 e235 e277 e339 e590 e606 0.8 0.7 0.6 0.5 0.4 0.9 1.0 Protistan OTU • Bacterial and Protistan OTU usually cluster within domains (e.g. protist with protist) • But certain Bacterial and Protistan OTU covary most closely with each other Relates Prokaryotic-Eukaryotic Ecology Rank correlation of occurrence of OTU Kendall Rank Similarity
Phylogenetic breakdown of Euks in 18S libraries from the time-series. M.O. 2001 ARB Tax. 2,224 clones (400 – 650 bp ea.)
What about species diversity? Protistan taxa are morphologically defined. You might think that would be an advantage, and yet… -Complexity of taxonomy(ies) multiple fixation procedures multiple analytical procedures diverse taxonomic characters -Deficiencies of taxonomy small species (few characters) morphologically amorphous species convergent evolution -Demands of ecological research high sample number complexity of natural assemblages
There is a need to develop practical guidelines for defining OTUs for protistan taxa based on rDNA sequence information. Our approach: • Select complete 18S sequences of ‘well-defined’ (i.e. morphologically-defined) protistan species from GenBank. • Perform all pairwise comparisons of full-length sequences. • examine intra-species (strain-strain) sequence variability. • examine inter-species sequence variability. • Attempt to determine logical demarcation (% similarity) for species-level distinction. • Apply criteria to environmental sequence databases for assessing microbial eukaryote diversity. Caveats: -This will not resolve the issue of the ‘species concept’. -Ultimately, multiple gene sequences will provide identity.
Consequences of varying percent similarity for OTU calling. (application to real data) Results for 970 environmental 18S clone sequences from a sample in the Coastal western North Atlantic
‘Taxon-level’ distinction ≈1200 18S clones (Single date, 6 depths, USC M.O. site) Frequency of Taxonomic Unit Taxonomic Units *Large Euk diversity (488 OTUs; 95% similarity: pairwise alignments). *Most OTUs are rare (large number of ‘background’ of taxa).
Global distribution or Endemism? Jury still out! Study in Coastal N. Atlantic 72-hr bottle incubation Natural light; ambient temp. 970 clones analyzed. 165 Total phylotypes (95%). 68% (108 out of 165) observed at only one sampling time. Only 18% observed at all 3 sampling times. Global distribution or Endemism? Countway et al. (2005), GenBank accession AY937465-AY938434
Phaeocystis (Haptophyte) Lingulodinium (Dinoflagellate) The Daily Breeze: May 12, 2002 Pseudonitzschia (Diatom) Chrétiennot-Dinet et al., 1995 Ostreococcus (Chlorophyte) Target Organisms – Caron Lab
Haptophytes Cryptophytes 4% 4% Stramenopiles 2% Other Chlorophytes 9.1% Dinoflagellates Ostreococcus 38.2% 9.1% Unclass. Eukaryotes 14.5% Ciliates 20.0% Ostreococcus T-RFLP signature at the Chl a Max: July 2001 Percent of total amplified DNA 9.8% 10.7% 11.3% Caron, Countway & Brown (2004)
In parting, two popular microbial myths… (and their corollaries) The ‘age of discovery’ in oceanography is over. (if you believe this, you’ve come to the wrong workshop) C1: We have accurate estimates of protistan diversity. We know a lot of common morphotypes, but... (There is genetic diversity we don’t understand) (Relationship between morphology, sequence identity and physiology is poorly known; we lack ecologicaltools) We can forget about (or ignore) the species concept. C1: The ‘omes’ (genome, transcriptome, proteome, metabolome) will ‘tell all’. The species (however defined) is the evolutionary unit; not the gene, not the assemblage, not the community. The problem (sp. concept) is different for proks and euks.