Download
1 / 97
1.01k likes | 1.45k Views
RTI: How to Collect Data to Understand and Fix Student Academic and Behavioral Problems Jim Wright www.interventioncentral.org.

E N D
RTI: How to Collect Data to Understandand Fix Student Academic and BehavioralProblems Jim Wrightwww.interventioncentral.org
Evaluation. “the process of using information collected through assessment to make decisions or reach conclusions.” (Hosp, 2008; p. 364). Example: A student can be evaluated for problems in ‘fluency with text’ by collecting information using various sources (e.g., CBM ORF, teacher interview, direct observations of the student reading across settings, etc.), comparing those results to peer norms or curriculum expectations, and making a decision about whether the student’s current performance is acceptable. Data Collection: Defining Terms Assessment. “the process of collecting information about the characteristics of persons or objects by measuring them. ” (Hosp, 2008; p. 364). Example: The construct ‘fluency with text’ can be assessed using various measurements, including CBM ORF, teacher interview, and direct observations of the student reading in different settings and in different material. Measurement. “the process of applying numbers to the characteristics of objects or people in a systematic way” (Hosp, 2008; p. 364). Example: Curriculum-Based Measurement Oral Reading Fluency (CBM ORF) is one method to measure the construct ‘fluency with text’
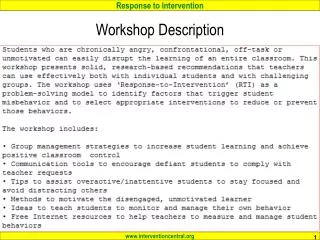
Formal Tests: Only One Source of Student Assessment Information “Tests are often overused and misunderstood in and out of the field of school psychology. When necessary, analog [i.e., test] observations can be used to test relevant hypotheses within controlled conditions. Testing is a highly standardized form of observation. ….The only reason to administer a test is to answer well-specified questions and examine well-specified hypotheses. It is best practice to identify and make explicit the most relevant questions before assessment begins. …The process of assessment should follow these questions. The questions should not follow assessment. “ p.170 Source: Christ, T. (2008). Best practices in problem analysis. In A. Thomas & J. Grimes (Eds.), Best practices in school psychology V (pp. 159-176). Bethesda, MD: National Association of School Psychologists.
Relevant Academic Information: Sources and Purpose • Tier 1: Instructional information. Teachers do classroom assessments (both formal and informal). Results are used to make day-to-day decisions about pacing of instruction, to determine students who need additional support, etc. • Tier 1/Tier 2: Schoolwide screenings. Brief universal screenings are administered to all students at a grade level to measure academic skills that predict future school success. Results reflect on quality of core instruction and drive recruitment for Tier 2 programs. • Tier 3: Analytic/diagnostic instructional assessment. Struggling students with more severe needs picked up in screenings may be administered a more detailed assessment (using qualitative and/or quantitative measures) to map out pattern of deficits in basic academic skills. Results are used to create a customized intervention plan that meets that student’s unique needs.
Universal Screening at Secondary Schools: Using Existing Data Proactively to Flag ‘Signs of Disengagement’ “Across interventions…, a key component to promoting school completion is the systematic monitoring of all students for signs of disengagement, such as attendance and behavior problems, failing courses, off track in terms of credits earned toward graduation, problematic or few close relationships with peers and/or teachers, and then following up with those who are at risk.” Source: Jimerson, S., Reschly, A.L., & Hess, R. (2008). Best practices in increasing the likelihood of school completion. In A. Thomas & J. Grimes (Eds). Best Practices in School Psychology - 5th Ed (pp. 1085-1097). Bethesda, MD: National Association of School Psychologists.. p.1090
Extant (Existing) Data (Chafouleas et al., 2007) • Definition: Information that is collected by schools as a matter of course. • Extant data comes in two forms: • Performance summaries (e.g., class grades, teacher summary comments on report cards, state test scores). • Student work products (e.g., research papers, math homework, PowerPoint presentation). Source: Chafouleas, S., Riley-Tillman, T.C., & Sugai, G. (2007). School-based behavioral assessment: Informing intervention and instruction. New York: Guilford Press.
Advantages of Using Extant Data (Chafouleas et al., 2007) • Information is already existing and easy to access. • Students will not show ‘reactive’ effects during data collection, as the information collected is part of the normal routine of schools. • Extant data is ‘relevant’ to school data consumers (such as classroom teachers, administrators, and members of problem-solving teams). Source: Chafouleas, S., Riley-Tillman, T.C., & Sugai, G. (2007). School-based behavioral assessment: Informing intervention and instruction. New York: Guilford Press.
Drawbacks of Using Extant Data (Chafouleas et al., 2007) • Time is required to collate and summarize the data (e.g., summarizing a week’s worth of disciplinary office referrals). • The data may be limited and not reveal the full dimension of the student’s presenting problem(s). • There is no guarantee that school staff are consistent and accurate in how they collect the data (e.g., grading policies can vary across classrooms; instructors may have differing expectations regarding what types of assignments are given a formal grade; standards may fluctuate across teachers for filling out disciplinary referrals). • Little research has been done on the ‘psychometric adequacy’ of extant data sources. Source: Chafouleas, S., Riley-Tillman, T.C., & Sugai, G. (2007). School-based behavioral assessment: Informing intervention and instruction. New York: Guilford Press.
Universal Screening at Secondary Schools: Using Existing Data Proactively to Flag ‘Signs of Disengagement’ “Across interventions…, a key component to promoting school completion is the systematic monitoring of all students for signs of disengagement, such as attendance and behavior problems, failing courses, off track in terms of credits earned toward graduation, problematic or few close relationships with peers and/or teachers, and then following up with those who are at risk.” Source: Jimerson, S., Reschly, A.L., & Hess, R. (2008). Best practices in increasing the likelihood of school completion. In A. Thomas & J. Grimes (Eds). Best Practices in School Psychology - 5th Ed (pp. 1085-1097). Bethesda, MD: National Association of School Psychologists.. p.1090
Mining Archival Data: What Are the ‘Early Warning Flags’ of Student Drop-Out? A sample of 13,000 students in Philadelphia were tracked for 8 years. These early warning indicators were found to predict student drop-out in the sixth-grade year: • Failure in English • Failure in math • Missing at least 20% of school days • Receiving an ‘unsatisfactory’ behavior rating from at least one teacher Source: Balfanz, R., Herzog, L., MacIver, D. J. (2007). Preventing student disengagement and keeping students on the graduation path in urban middle grades schools: Early identification and effective interventions. Educational Psychologist,42, 223–235. .
What is the Predictive Power of These Early Warning Flags? Source: Balfanz, R., Herzog, L., MacIver, D. J. (2007). Preventing student disengagement and keeping students on the graduation path in urban middle grades schools: Early identification and effective interventions. Educational Psychologist,42, 223–235. .
Grades & Other Teacher Performance Summary Data (Chafouleas et al., 2007) • Teacher test and quiz grades can be useful as a supplemental method for monitoring the impact of student behavioral interventions. • Other data about student academic performance (e.g., homework completion, homework grades, etc.) can also be tracked and graphed to judge intervention effectiveness. Source: Chafouleas, S., Riley-Tillman, T.C., & Sugai, G. (2007). School-based behavioral assessment: Informing intervention and instruction. New York: Guilford Press.
2-Wk 9/23/07 4-Wk 10/07/07 6-Wk 10/21/07 8-Wk 11/03/07 10-Wk 11/20/07 12-Wk 12/05/07 Marc Ripley (From Chafouleas et al., 2007) Source: Chafouleas, S., Riley-Tillman, T.C., & Sugai, G. (2007). School-based behavioral assessment: Informing intervention and instruction. New York: Guilford Press.
‘Elbow Group’ Activity: What Extant/Archival Data Should Your RTI Team Review Regularly? • Discuss the essential extant/archival data that your RTI Team should review as ‘early warning indicators’ of students who are struggling (see p. 20 of packet). • What process should your school adopt to ensure that these data are reviewed regularly (e.g., every five weeks) to guarantee timely identification of students who need intervention assistance?
RIOT/ICEL Framework: Organizing Information to Better Identify Student Behavioral & Academic Problems
Assessment Data: Reaching the ‘Saturation Point’ “…During the process of assessment, a point of saturation is always reached; that is, the point when enough information has been collected to make a good decision, but adding additional information will not improve the decision making. It sounds simple enough, but the tricky part is determining when that point has been reached. Unfortunately, information cannot be measured in pounds, decibels, degrees, or feet so there is no absolute amount of information or specific criterion for “enough” information.” p. 373 Source: Hosp, J. L. (2008). Best practices in aligning academic assessment with instruction. In A. Thomas & J. Grimes (Eds.), Best practices in school psychology V (pp.363-376). Bethesda, MD: National Association of School Psychologists.
RIOT/ICEL Framework Sources of Information • Review (of records) • Interview • Observation • Test Focus of Assessment • Instruction • Curriculum • Environment • Learner
RIOT/ICEL Definition • The RIOT/ICEL matrix is an assessment guide to help schools efficiently to decide what relevant information to collect on student academic performance and behavior—and also how to organize that information to identify probable reasons why the student is not experiencing academic or behavioral success. • The RIOT/ICEL matrix is not itself a data collection instrument. Instead, it is an organizing framework, or heuristic, that increases schools’ confidence both in the quality of the data that they collect and the findings that emerge from the data.
RIOT: Sources of Information • Select Multiple Sources of Information: RIOT (Review, Interview, Observation, Test). The top horizontal row of the RIOT/ICEL table includes four potential sources of student information: Review, Interview, Observation, and Test (RIOT). Schools should attempt to collect information from a range of sources to control for potential bias from any one source.
Select Multiple Sources of Information: RIOT (Review, Interview, Observation, Test) • Review. This category consists of past or present records collected on the student. Obvious examples include report cards, office disciplinary referral data, state test results, and attendance records. Less obvious examples include student work samples, physical products of teacher interventions (e.g., a sticker chart used to reward positive student behaviors), and emails sent by a teacher to a parent detailing concerns about a student’s study and organizational skills.
Select Multiple Sources of Information: RIOT (Review, Interview, Observation, Test) • Interview. Interviews can be conducted face-to-face, via telephone, or even through email correspondence. Interviews can also be structured (that is, using a pre-determined series of questions) or follow an open-ended format, with questions guided by information supplied by the respondent. Interview targets can include those teachers, paraprofessionals, administrators, and support staff in the school setting who have worked with or had interactions with the student in the present or past. Prospective interview candidates can also consist of parents and other relatives of the student as well as the student himself or herself.
Select Multiple Sources of Information: RIOT (Review, Interview, Observation, Test) • Observation. Direct observation of the student’s academic skills, study and organizational strategies, degree of attentional focus, and general conduct can be a useful channel of information. Observations can be more structured (e.g., tallying the frequency of call-outs or calculating the percentage of on-task intervals during a class period) or less structured (e.g., observing a student and writing a running narrative of the observed events).
Select Multiple Sources of Information: RIOT (Review, Interview, Observation, Test) • Test. Testing can be thought of as a structured and standardized observation of the student that is intended to test certain hypotheses about why the student might be struggling and what school supports would logically benefit the student (Christ, 2008). An example of testing may be a student being administered a math computation CBM probe or an Early Math Fluency probe.
Formal Tests: Only One Source of Student Assessment Information “Tests are often overused and misunderstood in and out of the field of school psychology. When necessary, analog [i.e., test] observations can be used to test relevant hypotheses within controlled conditions. Testing is a highly standardized form of observation. ….The only reason to administer a test is to answer well-specified questions and examine well-specified hypotheses. It is best practice to identify and make explicit the most relevant questions before assessment begins. …The process of assessment should follow these questions. The questions should not follow assessment. “ p.170 Source: Christ, T. (2008). Best practices in problem analysis. In A. Thomas & J. Grimes (Eds.), Best practices in school psychology V (pp. 159-176). Bethesda, MD: National Association of School Psychologists.
ICEL: Factors Impacting Student Learning • Investigate Multiple Factors Affecting Student Learning: ICEL (Instruction, Curriculum, Environment, Learner). The leftmost vertical column of the RIO/ICEL table includes four key domains of learning to be assessed: Instruction, Curriculum, Environment, and Learner (ICEL). A common mistake that schools often make is to assume that student learning problems exist primarily in the learner and to underestimate the degree to which teacher instructional strategies, curriculum demands, and environmental influences impact the learner’s academic performance. The ICEL elements ensure that a full range of relevant explanations for student problems are examined.
Investigate Multiple Factors Affecting Student Learning: ICEL (Instruction, Curriculum, Environment, Learner) • Instruction. The purpose of investigating the ‘instruction’ domain is to uncover any instructional practices that either help the student to learn more effectively or interfere with that student’s learning. More obvious instructional questions to investigate would be whether specific teaching strategies for activating prior knowledge better prepare the student to master new information or whether a student benefits optimally from the large-group lecture format that is often used in a classroom. A less obvious example of an instructional question would be whether a particular student learns better through teacher-delivered or self-directed, computer-administered instruction.
Investigate Multiple Factors Affecting Student Learning: ICEL (Instruction, Curriculum, Environment, Learner) • Curriculum. ‘Curriculum’ represents the full set of academic skills that a student is expected to have mastered in a specific academic area at a given point in time. To adequately evaluate a student’s acquisition of academic skills, of course, the educator must (1) know the school’s curriculum (and related state academic performance standards), (2) be able to inventory the specific academic skills that the student currently possesses, and then (3) identify gaps between curriculum expectations and actual student skills. (This process of uncovering student academic skill gaps is sometimes referred to as ‘instructional’ or ‘analytic’ assessment.)
Investigate Multiple Factors Affecting Student Learning: ICEL (Instruction, Curriculum, Environment, Learner) • Environment. The ‘environment’ includes any factors in the student’s school, community, or home surroundings that can directly enable their academic success or hinder that success. Obvious questions about environmental factors that impact learning include whether a student’s educational performance is better or worse in the presence of certain peers and whether having additional adult supervision during a study hall results in higher student work productivity. Less obvious questions about the learning environment include whether a student has a setting at home that is conducive to completing homework or whether chaotic hallway conditions are delaying that student’s transitioning between classes and therefore reducing available learning time.
Investigate Multiple Factors Affecting Student Learning: ICEL (Instruction, Curriculum, Environment, Learner) • Learner. While the student is at the center of any questions of instruction, curriculum, and [learning] environment, the ‘learner’ domain includes those qualities of the student that represent their unique capacities and traits. More obvious examples of questions that relate to the learner include investigating whether a student has stable and high rates of inattention across different classrooms or evaluating the efficiency of a student’s study habits and test-taking skills. A less obvious example of a question that relates to the learner is whether a student harbors a low sense of self-efficacy in mathematics that is interfering with that learner’s willingness to put appropriate effort into math courses.
The teacher collects several student math computation worksheet samples to document work completion and accuracy. • Data Source: Review • Focus Areas: Curriculum
The student’s parent tells the teacher that her son’s reading grades and attitude toward reading dropped suddenly in Gr 4. • Data Source: Interview • Focus: Curriculum, Learner
An observer monitors the student’s attention on an independent writing assignment—and later analyzes the work’s quality and completeness. • Data Sources: Observation, Review • Focus Areas: Curriculum, Environment, Learner
A student is given a timed math worksheet to complete. She is then given another timed worksheet & offered a reward if she improves. • Data Source: Review, Test • Focus Areas: Curriculum, Learner
Comments from several past report cards describe the student as preferring to socialize rather than work during small-group activities. • Data Source: Review • Focus Areas: Environment
The teacher tallies the number of redirects for an off-task student during discussion. She designs a high-interest lesson, still tracks off-task behavior. • Data Source: Observation, Test • Focus Areas: Instruction
Uses of RIOT/ICEL The RIOT/ICEL framework is adaptable and can be used flexibly: e.g.: • The teacher can be given the framework to encourage fuller use of available classroom data, examination of environmental and curiculum variables impacting learning. • The RTI Team case manager can use the framework when pre-meeting with the teacher to better define the student problem, select data to bring to the initial RTI Team meeting. • Any RTI consultant working at any Tier can internalize the framework as a mental guide to prompt fuller consideration of available data, efficiency in collecting data, and stronger formulation of student problems.
Activity: Use the RIOT/ICEL Framework • Review the RIOT/ICEL matrix. • Discuss how you might use the framework to ensure that information that you collect on a student is broad-based, comes from multiple sources, and answers the right questions about the identified student problem(s). • Be prepared to report out.
Breaking Down Complex Academic Goals into Simpler Sub-Tasks: Discrete Categorization
Identifying and Measuring Complex Academic Problems at the Middle and High School Level • Students at the secondary level can present with a range of concerns that interfere with academic success. • One frequent challenge for these students is the need to reduce complex global academic goals into discrete sub-skills that can be individually measured and tracked over time.
Discrete Categorization: A Strategy for Assessing Complex, Multi-Step Student Academic Tasks Definition of Discrete Categorization: ‘Listing a number of behaviors and checking off whether they were performed.’ (Kazdin, 1989, p. 59). • Approach allows educators to define a larger ‘behavioral’ goal for a student and to break that goal down into sub-tasks. (Each sub-task should be defined in such a way that it can be scored as ‘successfully accomplished’ or ‘not accomplished’.) • The constituent behaviors that make up the larger behavioral goal need not be directly related to each other. For example, ‘completed homework’ may include as sub-tasks ‘wrote down homework assignment correctly’ and ‘created a work plan before starting homework’ Source: Kazdin, A. E. (1989). Behavior modification in applied settings (4th ed.). Pacific Gove, CA: Brooks/Cole..
Discrete Categorization Example: Math Study Skills General Academic Goal: Improve Tina’s Math Study Skills Tina was struggling in her mathematics course because of poor study skills. The RTI Team and math teacher analyzed Tina’s math study skills and decided that, to study effectively, she needed to: • Check her math notes daily for completeness. • Review her math notes daily. • Start her math homework in a structured school setting. • Use a highlighter and ‘margin notes’ to mark questions or areas of confusion in her notes or on the daily assignment. • Spend sufficient ‘seat time’ at home each day completing homework. • Regularly ask math questions of her teacher.
Discrete Categorization Example: Math Study Skills General Academic Goal: Improve Tina’s Math Study Skills The RTI Team—with teacher and student input—created the following intervention plan. The student Tina will: • Approach the teacher at the end of class for a copy of class note. • Check her daily math notes for completeness against a set of teacher notes in 5th period study hall. • Review her math notes in 5th period study hall. • Start her math homework in 5th period study hall. • Use a highlighter and ‘margin notes’ to mark questions or areas of confusion in her notes or on the daily assignment. • Enter into her ‘homework log’ the amount of time spent that evening doing homework and noted any questions or areas of confusion. • Stop by the math teacher’s classroom during help periods (T & Th only) to ask highlighted questions (or to verify that Tina understood that week’s instructional content) and to review the homework log.
Discrete Categorization Example: Math Study Skills Academic Goal: Improve Tina’s Math Study Skills General measures of the success of this intervention include (1) rate of homework completion and (2) quiz & test grades. To measure treatment fidelity (Tina’s follow-through with sub-tasks of the checklist), the following strategies are used : • Approached the teacher for copy of class notes. Teacher observation. • Checked her daily math notes for completeness; reviewed math notes, started math homework in 5th period study hall. Student work products; random spot check by study hall supervisor. • Used a highlighter and ‘margin notes’ to mark questions or areas of confusion in her notes or on the daily assignment. Review of notes by teacher during T/Th drop-in period. • Entered into her ‘homework log’ the amount of time spent that evening doing homework and noted any questions or areas of confusion. Log reviewed by teacher during T/Th drop-in period. • Stopped by the math teacher’s classroom during help periods (T & Th only) to ask highlighted questions (or to verify that Tina understood that week’s instructional content). Teacher observation; student sign-in.
CBM: Developing a Process to Collect Local Norms/Screening DataJim Wrightwww.interventioncentral.org
RTI Literacy: Assessment & Progress-Monitoring To measure student ‘response to instruction/intervention’ effectively, the RTI model measures students’ academic performance and progress on schedules matched to each student’s risk profile and intervention Tier membership. • Benchmarking/Universal Screening. All children in a grade level are assessed at least 3 times per year on a common collection of academic assessments. • Strategic Monitoring. Students placed in Tier 2 (supplemental) reading groups are assessed 1-2 times per month to gauge their progress with this intervention. • Intensive Monitoring. Students who participate in an intensive, individualized Tier 3 intervention are assessed at least once per week. Source: Burns, M. K., & Gibbons, K. A. (2008). Implementing response-to-intervention in elementary and secondary schools: Procedures to assure scientific-based practices. New York: Routledge.
Local Norms: Screening All Students (Stewart & Silberglit, 2008) Local norm data in basic academic skills are collected at least 3 times per year (fall, winter, spring). • Schools should consider using ‘curriculum-linked’ measures such as Curriculum-Based Measurement that will show generalized student growth in response to learning. • If possible, schools should consider avoiding ‘curriculum-locked’ measures that are tied to a single commercial instructional program. Source: Stewart, L. H. & Silberglit, B. (2008). Best practices in developing academic local norms. In A. Thomas & J. Grimes (Eds.), Best practices in school psychology V (pp. 225-242). Bethesda, MD: National Association of School Psychologists.
Local Norms: Using a Wide Variety of Data (Stewart & Silberglit, 2008) Local norms can be compiled using: • Fluency measures such as Curriculum-Based Measurement. • Existing data, such as office disciplinary referrals. • Computer-delivered assessments, e.g., Measures of Academic Progress (MAP) from www.nwea.org Source: Stewart, L. H. & Silberglit, B. (2008). Best practices in developing academic local norms. In A. Thomas & J. Grimes (Eds.), Best practices in school psychology V (pp. 225-242). Bethesda, MD: National Association of School Psychologists.