Download
1 / 72
720 likes | 834 Views
Learn about graph clustering for protein complexes, algorithm details, dense regions, and results in bioinformatics network analysis.

E N D
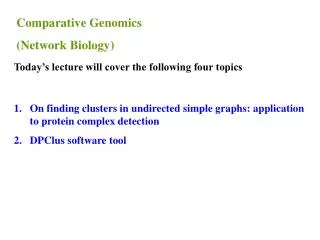
Comparative Genomics (Network Biology) Today’s lecture will cover the following four topics • On finding clusters in undirected simple graphs: application to protein complex detection • DPClus software tool
On finding clusters in undirected simple graphs: application to protein complex detection • Outline • Introduction • Some basic concepts • The proposed algorithm • The DPClus software • Results & Discussion • Conclusions
Introduction • There is no universal definition of a cluster. • But clustering is an important issue. • Consequently there are diverse definitions and various methods. • The major purpose of clustering is finding cohesive groups. • Here, we are going to discuss a graph clustering algorithm.
Introduction Regarding a graph, a cluster is a subgraph whose nodes are densely connected with each other compared to their connections with other nodes in the graph. This is a flexible definition of a cluster. Intuitively, we can recognize two clusters in this arbitrary graph. But it is difficult to draw a big graph revealing its clusters.
Introduction An E. coliprotein-protein interaction network---consisting of 3007 proteins and 11531 interactions (From Mori Lab NAIST, Japan) Some algorithm is needed to detect locally dense regions……
Introduction Md. Altaf-Ul-Amin, Yoko Shinbo, Kenji Mihara, Ken Kurokawa and Shigehiko Kanaya, “Development and implementation of an algorithm for detection of protein complexes in large interaction networks”, BMC Bioinformatics 7:207, April 2006.
Some basic concepts It is likely that two nodes belong to the same cluster have more common neighbors than two nodes that are not
Some basic concepts It is likely that two nodes belong to the same cluster have more common neighbors than two nodes that are not
Some basic concepts • The density d of a cluster is the ratio of the number of edges present in it and the maximum possible number of edges in it. • It is easy to realize that d = |E|/|E|max = 2*|E|/|N|*(|N|-1). • d is a real number ranging from 0 to 1.
d=0.9 d=1.0 Some basic concepts Density of the total graph = 0.241 The density of the complexes are relatively higher
Some basic concepts Considering density alone is not enough • Both the graphs consist of 8 nodes and both are of density 0.5 • But one of them seems to be a single cluster while the other is divided into two clusters Such situations can be tackled by keeping track of the periphery
Some basic concepts The cluster property of any node n with respect to any cluster k of density dk and size Nk is defined as follows: cpnk=|Enk|/(dk* |Nk|) Here, |Enk| is the total number of edges between the node n and each of the nodes of cluster k. Cluster property of node f = 0.2 Cluster property of node f 0.57
The proposed Algorithm • The proposed algorithm is a sequential constructive algorithm: • It initializes the complex/cluster by choosing a seed node. • It then repeatedly add other nodes on the basis of priority and some conditions. • The major methods of the algorithm • Choosing a seed node. • Selecting a priority node. • Checking necessary conditions before adding a node to a complex.
The proposed Algorithm • Inputs to the algorithm are: • The associated matrix of the network. • A minimum threshold density for the generated clusters. • A parameter to determine how we separate a complex from its periphery. • Output of the algorithm are : • Overlapping/non-overlapping complexes whose densities are more or equal to the given density.
The proposed Algorithm Flowchart of the proposed Algorithm -
0 1 0 0 0 0 0 0 0 0 0 0 0 0 1 0 1 1 0 1 0 0 0 0 0 0 0 0 0 1 0 1 1 1 0 0 0 0 0 0 0 0 0 1 1 0 1 1 0 1 0 0 0 0 0 0 0 0 1 1 0 1 0 0 0 0 0 0 0 0 0 1 1 1 1 0 1 0 0 0 0 0 0 0 0 0 0 0 0 1 0 0 0 0 1 0 0 0 0 0 0 1 0 0 0 0 1 0 0 0 0 0 0 0 0 0 0 0 0 1 0 1 0 0 1 1 0 0 0 0 0 0 0 0 1 0 1 0 1 1 0 0 0 0 0 0 1 0 0 1 0 0 0 0 0 0 0 0 0 0 0 0 0 0 0 0 1 0 0 0 0 0 0 0 0 0 1 1 0 1 0 1 0 0 0 0 0 0 0 0 1 1 0 0 1 0 M = The proposed Algorithm Muv = 1 if there is an edge between nodes u and v and 0 otherwise.
1 0 1 1 0 1 0 0 0 0 0 0 0 0 0 4 2 2 3 2 1 1 0 0 0 0 0 0 1 2 4 3 2 3 1 1 0 0 0 0 0 0 1 2 3 5 2 3 1 0 1 0 0 0 0 0 0 3 2 2 3 2 1 1 0 0 0 0 0 0 1 2 3 3 2 5 0 1 0 0 1 0 0 0 0 1 1 1 1 0 2 0 0 1 0 0 0 0 0 1 1 0 1 1 0 2 0 1 0 0 1 1 0 0 0 1 0 0 0 0 4 2 1 1 2 2 0 0 0 0 0 0 1 1 2 4 0 1 2 2 0 0 0 0 0 1 0 0 1 0 2 0 1 1 0 0 0 0 0 0 0 0 1 1 0 1 0 1 0 0 0 0 0 0 0 1 2 2 1 0 4 2 0 0 0 0 0 0 0 1 2 2 1 1 2 3 M2 = The proposed Algorithm (M2)uv for uv represents the number of common neighbor of the nodes u and v.
1 0 1 1 0 1 0 0 0 0 0 0 0 0 0 4 2 2 3 2 1 1 0 0 0 0 0 0 1 2 4 3 2 3 1 1 0 0 0 0 0 0 1 2 3 5 2 3 1 0 1 0 0 0 0 0 0 3 2 2 3 2 1 1 0 0 0 0 0 0 1 2 3 3 2 5 0 1 0 0 1 0 0 0 0 1 1 1 1 0 2 0 0 1 0 0 0 0 0 1 1 0 1 1 0 2 0 1 0 0 1 1 0 0 0 1 0 0 0 0 4 2 1 1 2 2 0 0 0 0 0 0 1 1 2 4 0 1 2 2 0 0 0 0 0 1 0 0 1 0 2 0 1 1 0 0 0 0 0 0 0 0 1 1 0 1 0 1 0 0 0 0 0 0 0 1 2 2 1 0 4 2 0 0 0 0 0 0 0 1 2 2 1 1 2 3 M2 = The proposed Algorithm (M2)uv for uv represents the number of common neighbor of the nodes u and v.
The proposed Algorithm 2 3 2 2 2 3 2 0 0 2 0 2 0 2 2 2 2 3 0 2 0 0 The weights of edges are derived by squaring the associated matrix of the graph
The proposed Algorithm 10 6 2 0 6 3 2 2 2 3 10 2 0 0 2 0 2 0 2 0 6 6 2 2 2 0 3 6 6 10 0 2 0 0 0 0 The weights of nodes (sum of the weights of the connecting edges)
The proposed Algorithm 10 Seed 6 2 0 6 3 2 2 2 3 10 2 0 0 2 0 2 0 2 0 6 6 2 2 2 0 3 6 6 10 0 2 0 0 0 0 Neighbors
The proposed Algorithm 10 6 2 0 6 3 2 2 2 3 10 2 0 0 2 0 2 0 2 0 6 6 2 2 2 0 3 6 6 10 0 2 0 0 0 0 cp of P3 = 1 Neighbors
The proposed Algorithm 10 6 d=1.0 2 0 6 3 2 2 2 3 10 2 0 0 2 0 2 0 2 0 6 6 2 2 2 0 3 6 6 10 0 2 0 0 0 0 Neighbors
The proposed Algorithm 10 6 d=1.0 2 0 6 3 2 2 2 3 10 2 0 0 2 0 2 0 2 0 6 6 2 2 2 0 3 6 6 10 0 2 0 0 0 0 cp of P5 = 1 Neighbors
The proposed Algorithm 10 6 d=1.0 2 0 6 3 2 2 2 3 10 2 0 0 2 0 2 0 2 0 6 6 2 2 2 0 3 6 6 10 0 2 0 0 0 0 cp of P1 = 1 Neighbors
The proposed Algorithm 10 6 d=1.0 2 0 6 3 2 2 2 3 10 2 0 0 2 0 2 0 2 0 6 6 2 2 2 0 3 6 6 10 0 2 0 0 0 0 Neighbors
The proposed Algorithm 10 6 d=1.0 2 0 6 3 2 2 2 3 10 2 0 0 2 0 2 0 2 0 6 6 2 2 2 0 3 6 6 10 0 2 0 0 0 0 cp of P4 = 0.75 Neighbors
The proposed Algorithm 10 6 d=0.9 2 0 6 3 2 2 2 3 10 2 0 0 2 0 2 0 2 0 6 6 2 2 2 0 3 6 6 10 0 2 0 0 0 0 Neighbors
Seed The proposed Algorithm 6 2 0 6 2 2 0 2 0 2 0 6 2 0 6 0 0 0 The remaining graph
The proposed Algorithm 6 d=1.0 2 0 6 2 2 0 2 0 2 0 6 2 0 6 0 0 0
The proposed Algorithm 6 d=1.0 2 0 6 2 2 0 2 0 2 0 6 2 0 6 0 0 0
The proposed Algorithm 6 d=1.0 2 0 6 2 2 0 2 0 2 0 6 2 0 6 0 0 0
The proposed Algorithm The remaining graph
The proposed Algorithm Clustering by the proposed algorithm
A B C D L E F G I K H (ⅰ) J Example
A B C D L E F G I K H (ⅰ) J 1. Input and Initialized cpin=0.4, din = 0.6
A 2 2 B 2 2 C 2 3 1 D 2 L 1 1 0 E F 1 0 1 G I 1 1 K H 1 1 J 1. Seed Selection-1: calculation of weights of edges
6 A 2 2 B 6 2 2 8 C 2 3 1 D 10 2 4 L 1 1 0 E 2 F 2 1 0 1 G 2 I 2 1 1 K 2 H 2 1 1 クラスター1のシード選択 (ⅲ) J 2 1. Seed selection-2: Calculation of weights of nodes Selected seed
2 2 Cluster 1 d1=1 A B 3 C 2 2 3 Cluster 1 d1=1 2 D 2 L 1 E 1 F G I K H クラスター1の形成 (ⅳ) J 2. Cluster formation-1 Calculation of weights of nodes Candidate merged to Cluster 1 1
Candidate merged to Cluster 1 4 Check thresholds OK d1=1/1=1 > 0.6 2. Cluster formation-2 A 4 cpC1=1/(1*1)=1 > 0.4 (cpin ) 2 B 2 2 C 2 D 1 2 1 L 3 E 1 F G I K H クラスター1の形成 (ⅴ) J
A B C D L E F G I K H クラスター1の形成 (ⅵ) J Cluster 1 d1=3/3=1 2. Cluster formation-3 2 cpA1=2/(1x2)=1>0.4 6 2 2 1 2 1 3 1
2. Cluster formation-4 Check thresholds OK d1=1/1=1 > 0.6 A cpB1=3/(1x3)=1 > 0.4 (cpin ) B C 1 3 D 2 L 1 E Candidate merged to Cluster 1 1 F G I K H クラスター1の形成 (ⅶ) J
2. Cluster formation-5 Check thresholds OK d1=8/10=0.8 > 0.6 A cpL1=2/(1*4)=0.5 > 0.4 (cpin ) B C D L 1 0 0 1 Candidate merged to Cluster 1 E 2 F G I K H クラスター1の形成 (ⅷ) J
Check thresholds OK d1=10/15=0.67 > 0.6 2. Cluster formation-6 A cpE1=2/(0.8*5)=0.6 > 0.4 (cpin ) B C D L 0 0 E F 0 0 G I K Candidate merged to Cluster 1 H クラスター1の探索 (ⅸ) J
Check thresholds Out d1=11/12=0.52 < 0.6 2. Cluster formation-7 A cpE1=1/(0.52*6)=0.32 < 0.4 (cpin ) B C D L 0 0 E F 0 0 G I K H クラスター1の探索 (ⅸ) J
Check thresholds Out d1=11/12=0.52 < 0.6 2. Cluster formation-8 A cpF1=1/(0.52*6)=0.32 < 0.4 (cpin ) B C D L 0 0 E F 0 0 G I K H クラスター1の探索 (ⅸ) J
Check thresholds Out d1=11/12=0.52 < 0.6 2. Cluster formation-8 A cpF1=1/(0.52*6)=0.0 < 0.4 (cpin ) B C D L 0 0 E F 0 0 G I K H クラスター1の探索 (ⅸ) J
F G I K H クラスター1を削除 (ⅹ) J 2. Cluster formation-9: Remove the edges and nodes belonging to Cluster 1
Results of Density Periphery Clustering A B C Cluster 1 d1=10/15=0.67 D L E F Cluster 3 d3=3/3=1 Cluster 2 d2=3/3=1 G I K H ⅰ 終了 (ⅹ) J
Results: Complexes in the E. coli PPI Network http://dip.mbi.ucla.edu/ DIP:339N GroEL DIP:1081N PrnP DIP:1025N CarB DIP:1026N CarA DIP:539N MalG DIP:508N MalE DIP:124N XerD DIP:726N XerC DIP:367N PntB DIP:366N PntA DIP:342N SbcC DIP:572N Gam -------------- --------- -------------- --------- -------------- --------- -------------- --------- The network of E. coli proteins consists of 363 interactions involving a total of 336 proteins