Sound
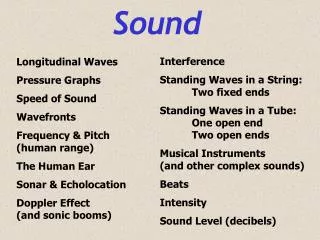
Sound. Interference Standing Waves in a String: Two fixed ends Standing Waves in a Tube: One open end Two open ends Musical Instruments (and other complex sounds) Beats Intensity Sound Level (decibels). Longitudinal Waves Pressure Graphs Speed of Sound Wavefronts

Sound
E N D
Presentation Transcript
Sound Interference Standing Waves in a String: Two fixed ends Standing Waves in a Tube: One open end Two open ends Musical Instruments (and other complex sounds) Beats Intensity Sound Level (decibels) Longitudinal Waves Pressure Graphs Speed of Sound Wavefronts Frequency & Pitch (human range) The Human Ear Sonar & Echolocation Doppler Effect (and sonic booms)
Longitudinal Waves As you learned in the unit on waves, in a longitudinal wave the particles in a medium travel back & forth parallel to the wave itself. Sound waves are longitudinal and they can travel through most any medium, so molecules of air (or water, etc.) move back & forth in the direction of the wave creating high pressure zones (compressions) and low pressure zones (rarefactions). The molecules act just like the individual coils in the spring. The faster the molecules move back & forth, the greater the frequency of the wave, and the greater distance they move, the greater the wave’s amplitude. molecule wavelength, compression rarefaction Animation
Sound Waves: Molecular View When sound travels through a medium, there are alternating regions of high and low pressure. Compressions are high pressure regions where the molecules are crowded together. Rarefactions are low pressure regions where the molecules are more spread out. An individual molecule moves side to side with each compression. The speed at which a compression propagates through the medium is the wave speed, but this is different than the speed of the molecules themselves. wavelength,
Pressurevs.Position The pressure at a given point in a medium fluctuates slightly as sound waves pass by. The wavelength is determined by the distance between consecutive compressions or consecutive rarefactions. At each com-pression the pressure is a tad bit higher than its normal pressure. At each rarefaction the pressure is a tad bit lower than normal. Let’s call the equilibrium (normal) pressure P0 and the difference in pressure from equilibriumP. P varies and is at a max at a compression or rarefaction. In a fluid like air or water, Pmax is typically very small compared to P0but our ears are very sensitive to slight deviations in pressure. The biggerPis, the greater the amplitude of the sound wave, and the louder the sound. wavelength,
A:P = 0; P = P0 B:P > 0; P = Pmax C:P < 0; P = Pmin Pressurevs.Position Graph animation P B x A C
Pressurevs.Time The pressure at a given point does not stay constant. If we only observed one position we would find the pressure there varies sinusoidally with time, ranging from: P0toP0 + Pmaxback toP0then toP0 - Pmaxand back toP0 The cycle can also be described as: equilibrium compression equilibrium rarefaction equilibrium The time it takes to go through this cycle is the period of the wave. The number of times this cycle happens per second is the frequency of the wave in Hertz. Therefore, the pressure in the medium is a function of both position and time!
Pressurevs.Time Graph P T t Rather than looking at a region of space at an instant in time, here we’re looking at just one point in space over an interval of time. At time zero, when the pressure readings began, the molecules were at their normal pressure. The pressure at this point in space fluctuates sinusoidally as the waves pass by: normal high normal low normal. The time needed for one cycle is the period. The higher the frequency, the shorter the period. The amplitude of the graph represents the maximum deviation from normal pressure (as it did on the pressure vs. position graph), and this corresponds to loudness.
Comparison of PressureGraphs Pressure vs. Position: The graph is for a snapshot in time and displays pressure variation for over an interval of space. The distance between peaks on the graph is the wavelength of the wave. Pressure vs. Time: The graph displays pressure variation over an interval of time for only one point in space. The distance between peaks on the graph is the period of the wave. The reciprocal of the period is the frequency. Both Graphs: Sound waves are longitudinal even though these graphs look like transverse waves. Nothing in a sound wave is actually waving in the shape of these graphs! The amplitude of either graph corresponds to the loudness of the sound. The absolute pressure matters not. For loudness, all that matters is how much the pressure deviates from its norm, which doesn’t have to be much. In real life the amplitude would diminish as the sound waves spread out.
Fµ v = B v = Speed of Sound As with all waves, the speed of sound depends on the medium through which it is traveling. In the wave unit we learned that the speed of a wave traveling on a rope is given by: F = tension in ropeµ = mass per unit length of rope Rope: In a rope, waves travel faster when the rope is under more tension and slower if the rope is denser. The speed of a sound wave is given by: B = bulk modulus of medium = mass per unit volume (density) Sound: The bulk modulus, B, of a medium basically tells you how hard it is to compress it, just as the tension in a rope tells you how hard it is stretch it or displace a piece of it. (continued)
elastic propertyinertial property v = Fµ v = B v = Speed of Sound (cont.) Notice that each equation is in the form Rope: Sound: The bulk modulus for air is tiny compared to that of water, since air is easily compressed and water nearly incompressible. So, even though water is much denser than air, water is so much harder to compress that sound travels over 4 times faster in water. Steel is almost 8 times denser than water, but it’s over 70 times harder to compress. Consequently, sound waves propagate through steel about 3 times faster than in water, since (70/8)0.5 3.
Mach Numbers Depending on temp, sound travels around 750 mph, which would be Mach 1. Twice this speed would be Mach 2, which is about the max speed for the F-22 Raptor. Speed Racer drives a car called “The Mach 5,” which would imply it can go 5 times the speed of sound.
B v = Temperature & the Speed of Sound Because the speed of sound is inversely proportional to the medium’s density, the less dense the medium, the faster sound travels. The hotter a substance is, the faster its molecules/atoms vibrate and the more room they take up. This lowers the substance’s density, which is significant in a gas. So, in the summer, sound travels slightly faster outside than it does in the winter. To visualize this keep in mind that molecules must bump into each other in order to transmit a longitudinal wave. When molecules move quickly, they need less time to bump into their neighbors. The speed of sound in dry air is given by:v 331.4 + 0.60 T, where T is air temp in°C. Here are speeds for sound: Air, 0 °C: 331 m/s Air, 20 °C: 343 m/s Water, 25 °C: 1493 m/s Iron: 5130 m/s Glass (Pyrex): 5640 m/s Diamond: 12000 m/s
Wavefronts crest trough Some waves are one dimensional, like vibrations in a guitar string or sound waves traveling along a metal rod. Some waves are two dimensional, such as surface water waves or seismic waves traveling along the surface of the Earth. Some waves are 3-D, such as sound traveling in all directions from a bell, or light doing the same from a flashlight. To visualize 2-D and 3-D waves, we often draw wavefronts. The red wavefronts below could represent the crest of water waves on a pond moving outward after a rock was dropped in the middle. They could also be used to represent high pressure zonesin sound waves. The wavefronts for 3-D sound waves would be spherical, but concentric circles are often used to simplify the picture. If the wavefronts are evenly spaced, then is a constant. Animation
Frequency&Pitch Just as the amplitude of a sound wave relates to its loudness, the frequency of the wave relates to its pitch. The higher the pitch, the higher the frequency. The frequency you hear is just the number of wavefronts that hit your eardrums in a unit of time. Wavelength doesn’t necessarily correspond to pitch because, even if wavefronts are very close together, if the wave is slow moving, not many wavefronts will hit you each second. Even in a fast moving wave with a small wavelength, the receiver or source could be moving, which would change the frequency, hence the pitch. Frequency Pitch Amplitude Loudness Listen to a pure tone (up to 1000 Hz) Listen to 2 simultaneous tones (scroll down)
The Human Ear The exterior part of the ear (the auricle, or pinna) is made of cartilage and helps funnel sound waves into the auditory canal, which has wax fibers to protect the ear from dirt. At the end of the auditory canal lies the eardrum (tympanic membrane), which vibrates with the incoming sound waves and transmits these vibrations along three tiny bones (ossicles) called the hammer, anvil, and stirrup (malleus, incus, and stapes). The little stapes bone is attached to the oval window, a membrane of the cochlea. The cochlea is a coil that converts the vibrations it receives into electrical impulses and sends them to the brain via the auditory nerve. Delicate hairs (stereocilia) in the cochlea are responsible for this signal conversion. These hairs are easily damaged by loud noises, a major cause of hearing loss! The semicircular canals help maintain balance, but do not aid hearing. Ear Anatomy Animation
Range of Human Hearing The maximum range of frequencies for most people is from about 20 to 20thousand hertz. This means if the number of high pressure fronts (wavefronts) hitting our eardrums each second is from 20 to 20000, then the sound may be detectable. If you listen to loud music often, you’ll probably find that your range (bandwidth) will be diminished. Some animals, like dogs and some fish, can hear frequencies that are higher than what humans can hear (ultrasound). Bats and dolphins use ultrasound to locate prey (echolocation). Doctors make use of ultrasound for imaging fetuses and breaking up kidney stones. Elephants and some whales can communicate over vast distances with sound waves too low in pitch for us to hear (infrasound). Hear the full range of audible frequencies(scroll down to speaker buttons)
Echoes&Reverberation An echo is simply a reflected sound wave. Echoes are more noticeable if you are out in the open except for a distant, large object. If went out to the dessert and yelled, you might hear a distant canyon yell back at you. The time between your yell and hearing your echo depends on the speed of sound and on the distance to the to the canyon. In fact, if you know the speed of sound, you can easily calculate the distance just by timing the delay of your echo. Reverberation is the repeated reflection of sound at close quarters. If you were to yell while inside a narrow tunnel, your reflected sound waves would bounce back to your ears so quickly that your brain wouldn’t be able to distinguish between the original yell and its reflection. It would sound like a single yell of slightly longer duration. Animation
Sonar SOund NAvigation and Ranging In addition to locating prey, bats and dolphins use sound waves for navigational purposes. Submarines do this too. The principle is to send out sound waves and listen for echoes. The longer it takes an echo to return, the farther away the object that reflected those waves. Sonar is used in commercial fishing boats to find schools of fish. Scientists use it to map the ocean floor. Special glasses that make use of sonar can help blind people by producing sounds of different pitches depending on how close an obstacle is. If radio (low frequency light) waves are used instead of sound in an instrument, we call it radar(radio detection and ranging).
Doppler Effect A tone is not always heard at the same frequency at which it is emitted. When a train sounds its horn as it passes by, the pitch of the horn changes from high to low. Any time there is relative motion between the source of a sound and the receiver of it, there is a difference between the actual frequency and the observed frequency. This is called the Doppler effect. Click to hear effect: The Doppler effect applied to electomagnetic waves helps meteorologists to predict weather, allows astronomers to estimate distances to remote galaxies, and aids police officers catch you speeding. The Doppler effect applied to ultrasound is used by doctors to measure the speed of blood in blood vessels, just like a cop’s radar gun. The faster the blood cell are moving toward the doc, the greater the reflected frequency. Animation(click on “The Doppler Effect”, then click on the button marked:
Sonic Booms When a source of sound is moving at the speed of sound, the wavefronts pile up on top of each other. This makes their combined amplitude very large, resulting in a shock wave and a sonic boom. At supersonic speeds a “Mach cone” is formed. The faster the source compared to sound, the smaller the shock wave angle will be. Wavefront AnimationsAnother cool animation Animation with sound (click on “The Doppler Effect”, then click on the button marked: Movie: F-18 Hornet breaking the sound barrier (click on MPEG movie)
) ( v vL fL=fS v vS Doppler Equation fL = frequency as heard by a listener fS = frequency produced by the source v = speed of sound in the medium vL = speed of the listener vS = speed of the source This equation takes into account the speed of the source of the sound, as well as the listener’s speed, relative to the air (or whatever the medium happens to be). The only tricky part is the signs. First decide whether the motion will make the observed frequency higher or lower. (If the source is moving toward the listener, this will increase fL, but if the listener is moving away from the source, this will decrease fL.) Then choose the plus or minus as appropriate. A plus sign in the numerator will make fL bigger, but a plus in the denominator will make fL smaller. Examples are on the next slide.
) ( v vL fL=fS v vS Doppler Set-ups The horn is producing a pure 1000 Hz tone. Let’s find the frequency as heard by the listener in various motion scenarios. The speed of sound in air at 20 C is 343 m/s. ) ( 343 fL=1000 343 -10 = 1030 Hz still 10 m/s ) ( 343 + 10 fL=1000 343 = 1029 Hz still 10 m/s Note that these situation are not exactly symmetric. Also, in real life a horn does not produce a single tone. More examples on the next slide.
) ( v vL fL=fS v vS Doppler Set-ups (cont.) The horn is still producing a pure 1000 Hz tone. This time both the source and the listener are moving with respect to the air. ) ( 343 - 3 fL=1000 343 -10 = 1021 Hz 10 m/s 3 m/s ) ( 343 + 3 fL=1000 343 - 10 = 1039 Hz 10 m/s 3 m/s Note the when they’re moving toward each other, the highest frequency possible for the given speeds is heard. Continued . . .
) ( v vL fL=fS v vS Doppler Set-ups (cont.) The horn is still producing a pure 1000 Hz tone. Here are the final two motion scenarios. ) ( 343 - 3 fL=1000 343 + 10 = 963 Hz 10 m/s 3 m/s ) ( 343 + 3 fL=1000 343 + 10 = 980 Hz 10 m/s 3 m/s Note the when they’re moving toward each other, the highest frequency possible for the given speeds is heard. Continued . . .
( ) v vL ( ) 343 + vL fL=fS 750=650 v vS 343 - 21 vL= 28.5 m/s Doppler Problem Mr. Magoo & Betty Boop are heading toward each other. Mr. Magoo drives at 21 m/s and toots his horn (just for fun; he doesn’t actually see her). His horn sounds at 650 Hz. How fast should Betty drive so that she hears the horn at 750 Hz? Assume the speed o’ sound is 343 m/s. 21 m/s vL
A B C Interference As we saw in the wave presentation, waves can passes through each other and combine via superposition. Sound is no exception. The pic shows two sets of wavefronts, each from a point source of sound. (The frequencies are the same here, but this is not required for interference.) Wherever constructive interference happens, a listener will here a louder sound. Loudness is diminished where destructive interference occurs. A: 2 crests meet; constructive interference B: 2 troughs meet; constructive interference C: Crest meets trough; destructive interference
A B C Interference: Distance in Wavelengths We’ve got two point sources emitting the same wavelength. If the difference in distances from the listener to the point sources is a multiple of the wavelength, constructive interference will occur. Examples: Point A is 3 from the red center and 4 from the green center, a difference of 1. For B, the difference is zero. Since 1 and 0 are whole numbers, constructive interference happens at these points. If the difference in distance is an odd multiple of half the wavelength, destructive interference occurs. Example: Point C is 3.5 from the green center and 2 from the red center. The difference is 1.5 , so destructive interference occurs there. Animation
Interference: Sound Demo Using the link below you can play the same tone from each of your two computer speakers. If they were visible, the wavefronts would look just as it did on the last slide, except they would be spheres instead of circles. You can experience the interference by leaning side to side from various places in the room. If you do this, you should hear the loudness fluctuate. This is because your head is moving through points of constructive interference (loud spots) and destructive interference (quiet regions, or “dead spots”). Turning one speaker off will eliminate this effect, since there will be no interference. Listen to a pure tone (up to 1000 Hz)
Interference: Noise Reduction The concept of interference is used to reduce noise. For example, some pilots where special headphones that analyze engine noise and produce the inverse of those sounds. This waves produced by the headphones interfere destructively with the sound waves coming from the engine. As a result, the noise is reduced, but other sounds can still be heard, since the engine noise has a distinctive wave pattern, and only those waves are being cancelled out. Noise reduction graphic (Scroll down to “Noise Cancellation” under the “Applications of Sound” heading.)
Acoustics Acoustics sometimes refers to the science of sound. It can also refer to how well sounds traveling in enclosed spaces can be heard. The Great Hall in the Krannert Center is an example of excellent acoustics. Chicago Symphony Orchestra has even recorded there. Note how the walls and ceiling are beveled to get sound waves reflect in different directions. This minimizes the odds of there being a “dead spot” somewhere in the audience. Click and scroll down to zoom in on the Great Hall pic.
Standing Waves: 2 Fixed Ends When a guitar string of length L is plucked, only certain frequencies can be produced, because only certain wavelengths can sustain themselves. Only standing waves persist. Many harmonics can exist at the same time, but the fundamental (n = 1) usually dominates. As we saw in the wave presentation, a standing wave occurs when a wave reflects off a boundary and interferes with itself in such a way as to produce nodes and antinodes. Destructive interference always occurs at a node. Both types occur at an antinode; they alternate. n = 2 n = 1 (fundamental) Node Antinode Animation: Harmonics 1, 2, & 3
2 L = n Wavelength Formula: 2 Fixed Ends(string of length L) = 2 L n = 1 = L n = 2 Notice the pattern is of the form: 23 =L n = 3 where n = 1, 2, 3, …. Thus, only certain wave-lengths can exists. To obtain tones corresponding to other wavelengths, one must press on the string to change its length. 12 =L n = 4
Vibrating String Example Schmedrick decides to build his own ukulele. One of the four strings has a mass of 20 g and a length of 38 cm. By turning the little knobby, Schmed cranks up the tension in this string to 300 N. What frequencies will this string produced when plucked? Hints: 1. Calculate the string’s mass per unit length, : 2. How the speed of a wave traveling on this string using the formula v = F/ from last chapter: 3. Calculate several wavelengths of standing waves on this string: 4. Calculate the corresponding frequencies: 0.0526 kg/m 75.498 m/s 0.76 m, 0.38 m, 0.2533 m 99 Hz, 199 Hz, 298 Hz Hear what a ukulele sounds like. (Scroll down.)
Standings Waves in a Tube: 2 Open Ends Like waves traveling on a string, sound waves traveling in a tube reflect back when they reach the end of the tube. (Much of the sound energy will exit the open tube, but some will reflect back.) If the wavelength is right, the reflected waves will combine with the original to create a standing wave. For a tube with two open ends, there will be an antinode at each end, rather than a node. (A closed end would correspond to a node, since it blocks the air from moving.) The pic shows the fundamental. Note: the air does not move like a guitar string moves; the curve represents the amount of vibration. Maximum vibration occurs at the antinodes. In the middle is a node where the air molecules don’t vibrate at all. Harmonics animation 1st, 2nd, and 3rd Harmonics n = 1 (fundamental)
2 L = n Wavelength Formula: 2 Open Ends(tube of length L) = 2 L n = 1 = L As with the string, the pattern is: n = 2 23 =L where n = 1, 2, 3, …. n = 3 Thus, only certain wave-lengths will reinforce each other (resonate). To obtain tones corresponding to other wavelengths, one must change the tube’s length. 12 =L n = 4
Standings Waves in a Tube:1 Open End If a tube has one open and one closed end, the open end is a region of maximum vibration of air molecules—an antinode. The closed end is where no vibration occurs—a node. At the closed end, only a small amount of the sound energy will be transmitted; most will be reflected. At the open end, of course, much more sound energy is transmitted, but a little is reflected. Only certain wavelengths of sound will resonate in this tube, which depends on it length. Harmonics animation 1st, 3rd, and 5thHarmonics animations(scroll down) n = 1 (fundamental)
34 L = 4 L n = L = n 4 Wavelength Formula: 1 Open End(tube of length L) 14 L = n = 1 This time the pattern is different: n = 3 54 L = or, n = 5 where n = 1, 3, 5, 7, …. 74 L = Note: only odd harmonics exist when only one end is open. n = 7
Tuning Forks&Resonance Tuning forks produce sound when struck because, as the tines vibrate back and forth, they bump into neighboring air molecules. (A speaker works in the same way.) Animation Touch a vibrating tuning fork to the surface of some water, and you’ll see the splashing. The more frequently the tines vibrate, the higher the frequency of the sound. The harmonics pics would look just like those for a tube with one open end. Smaller tuning forks make a high pitch sound, since a shorter length means a shorter wavelength. If a vibrating fork (A) is brought near one that is not vibrating (B), A will cause B to vibrate only if they made to produce the same frequency. This is an example of resonance. If the driving force (A) matches the natural fre-quency of B, then A can cause the amplitude of B to increase. (If you want to push someone on a swing higher and higher, you must push at the natural frequency of the swing.) A B
Resonance: Shattering a Glass Can sound waves really shatter a wine glass? Yes, if the frequency of the sound matches the natural frequency of the glass, and if the amplitude is sufficient. The glass’s natural frequency can be determined by flicking the glass with your finger and listening to the tone it makes. If the glass is being bombarded by sound waves of this freq-uency, the amplitude of the vibrating glass with grow and grow until the glass shatters.
Standing Waves:Musical Instruments As we saw with Schmedrick’s ukulele, string instruments make use of vibrations on strings where each end is a vibrational node. The strings themselves don’t move much air. So, either an electrical pickup and amplifier are needed, or the strings must transmit vibrations to the body of the instrument in which sound waves can resonate. Other instruments make use of standing waves in tubes. A flute for example can be approximated as cylindrical tubes with two open ends. A clarinet has just one open end. (The musician’s mouth blocks air in a clarinet, forming a closed end, but a flutist blows air over a hole without blocking the movement of air in and out.) Other instruments, like drums, produce sounds via standing waves on a surface, or membrane. Hear and See a Transverse Flute Hear a Clarinet, etc. (scroll down) Standing Waves on a Drum Animation
Complex Sounds Real sounds are rarely as simple as the individual standing wave patterns we’ve seen on a string or in a tube. Why is it that two different instruments can play the exact same note at the same volume, yet still sound so different? This is because many different harmonics can exist at the same time in an instrument, and the wave patterns can be very complex. If only fundamental frequencies could be heard, instruments would sound more alike. The relative strengths of different harmonics is known as timbre (tam’-ber). In other words, most sounds, including voices, are complex mixtures of frequencies. The sound made by a flute is predominately due to the first & second harmonics, so it’s waveform is fairly simple. The sounds of other instruments are more complicated due to the presence of additional harmonics. flute piano Combine Harmonics Create a Complex Sound violin
Octaves&Ratios Some mixtures of frequencies are pleasing to the ear; others are not. Typically, a harmonious combo of sounds is one in which the frequencies are in some simple ratio. If a fundamental frequency is combined with the 2nd harmonic, the ratio will be 1:2. (Each is the same musical note, but the 2nd harmonic is one octave higher. In other words, going up an octave means doubling the frequency.) Another simple (and therefore harmonious) ratio is2:3. This can be produced by playing a C note (262 Hz) with a G note (392 Hz).
Beats We’ve seen how many frequencies can combine to produce a complicated waveform. If two frequencies that are nearly the same combine, a phenomenon called beats occurs. The resulting waveform increases and decreases in amplitude in a periodic way, i.e., the sound gets louder and softer in a regular pattern. Hear Beats When two waves differ slightly in frequency, they are alternately in phase and out of phase. Suppose the two original waves have frequencies f1 and f2. Then their superposition (below) will have their average frequency and will get louder and softer with a frequency of | f1 - f2 |. fbeat = | f1 - f2 | f combo = (f1 + f2)/2 Beats Animation (click on “start simulation”) soft loud
Beats Example Mickey Mouse and Goofy are playing an E note. Mickey’s guitar is right on at 330 Hz, but Goofy is slightly out of tune at 332 Hz. 1. What frequency will the audience hear? 2. How often will the audience hear the sound getting louder and softer? 331 Hz, the average of the frequencies of the two guitars. They will hear it go from loud to soft twice each second. (The beat frequency is 2 Hz, since the two guitars differ in frequency by that amount.)
PA I = Intesity All waves carry energy. In a typical sound wave the pressure doesn’t vary much from the normal pressure of the medium. Consequently, sound waves don’t transmit a whole lot of energy. The more energy a sound wave transmits through a given area in a given amount of time, the more intensity it has, and the louder it will sound. That is, intensity is power per unit area: 1m2 Suppose that in one second the green wavefronts carry one joule of sound energy through the one square meter opening. Then the intensity at the red rectangle is 1 W/m2. (1 Watt = 1 J/s.) wavefronts
Since the wavefronts are approximately spherical, and the area of a sphere is proportional to the square of its radius (A = 4r2), the intensity is inversely propotional to the square of the distance (since I = P/A). So, cutting the distance by a factor of 3 will make the intensity of its ring about nine times greater. However, our ears do not work on a linear scale. The clock will sound less than twice as loud. Intensity Example If you place your alarm clock 3 times closer to your bed, how many times greater will the intensity be the next morning?answer:
Threshold Intensity The more intense a sound is, the louder it will be. Normal sounds carry small amounts of energy, but our ears are very sensitive. In fact, we can hear sounds with intensities as low as 10-12 W/m2! This is called the threshold intensity, I0. I0 =10-12 W/m2 This means that if we had enormous ears like Dumbo’s, say a full square meter in area, we could hear a sound delivering to this area an energy of only one trillionth of a joule each second! Since our ears are thousands of times smaller, the energy our ears receive in a second is thousands of times less.
= 10 log II0 Sound Level in Decibels The greater the intensity of a sound at a certain place, the louder it will sound. But doubling the intensity will not make it seem twice as loud. Experiments show that the intensity must increase by about a factor of 10 before the sound will seem twice as loud to us. A sound with a 100 times greater intensity will sound about 4 times louder. Therefore, we measure sound level (loudness) based on a logarithmic scale. The sound level in decibels (dB) is given by: (in decibels) Ex: At a certain distance from a siren, the intensity of the sound waves might be 10–5 W/m2. The sound level at this location would be: Note: According to this definition, a sound at the intensity level registers zero decibels: 10 log (10–5 / 10–12) = 10 log (107) = 70 dB 10 log (10–12 / 10–12) = 10 log (1) = 0 dB
The Decibel Scale The chart below lists the approximate sound levels of various sounds. The loudness of a given sound depends, of course, on the power of the source of the sound as well as the distance from the source. Note: Listening to loud music will gradually damage your hearing! Constant exposure leads to permanent hearing loss. } Pain Damage
I1/I0 I2/I0 = 10 log II0 Intensity&Sound Level Every time the intensity of a sound is increased by a factor of 10, the sound level goes up by 10 dB (and the sound seems to us to be about twice as loud). Let’s compare a 90 dB shout to a 30 dB whisper. The shout is 60 dB louder, which means its intensity is 10 to the 6th power (a million) times greater. Proof: 60 = 1 - 2 = 10 log (I1/I0) - 10 log(I2/I0) = 10 log 60 = 10 log (I1/I2) 6 = log (I1/I2) 106 = I1/I2 answers: factor of 100 Compare intensities: 80 dB vs. 60 dB Compare intensities: 100 dB vs. 75 dB Compare sound levels: 4.2·10 –4 W/m2vs. 4.2·10 –7 W/m2 factor of 316 (10 2.5 = 316) differ by 30 dB (I’s differ by 3 powers of 10 )