Download
1 / 28
280 likes | 402 Views
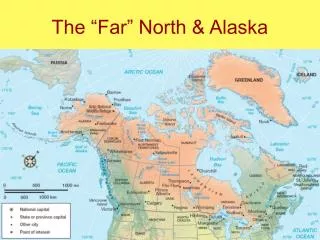
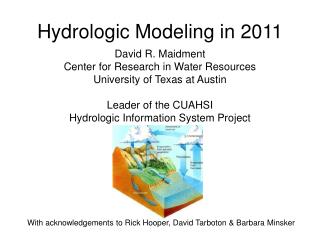
Hydrologic Modeling in the Far North: n eeds, challenges, and progress. Jessica Cherry International Arctic Research Center (IARC) and Institute of Northern Engineering, University of Alaska Fairbanks (UAF) & Northern Science Services

E N D
Hydrologic Modeling in the Far North: needs, challenges, and progress Jessica Cherry International Arctic Research Center (IARC) and Institute of Northern Engineering, University of Alaska Fairbanks (UAF) &Northern Science Services Bob Bolton, IARC and Scenarios Network for Alaska Planning (SNAP) at UAF Katrina Bennett, IARC Stephanie McAfee, SNAP Support Acknowledged from the JAMSTEC-IARC Cooperative Agreement, the U.S. Department of Energy, the Alaska Climate Science Center, and the National Science Foundation
Needs for Hydrologic Projection in Alaska J. Cherry Communities: many Alaskans live in environmentally sensitive communities, with tenuous water supplies, near rivers that are subject to flooding
Needs for Hydrologic Projection in Alaska Municipal, Rural, and Resource Land Managers: many agencies are increasingly accountable for anticipating future changes to their management areas. May or may not have the staff expertise to interpret and make use of projections.
Needs for Hydrologic Projection in Alaska Technical experts: such as engineers, scientists (including NOAA’s WFO/RFC) are potentially most aware of the model shortcomings, but are obligated to provide best available information for their end-users. J. Cherry
Challenges for Hydrologic Projection in Alaska • Climate Change is most amplified in the Arctic • Climate Models do a poor job of representing many cryospheric processes such as permafrost dynamics, glacial change, river ice, changes in subsurface water storage, etc • The historical observations in this region are particularly sparse and short • Our technology for measuring solid precipitation works poorly and changes are difficult to detect
Challenges for Hydrologic Projection in Alaska • Roles of Empirical and Process-based Models: • The latter may be particularly important for getting the mechanisms correct, i.e. getting projections right for the right reasons • ‘Tipping points’ are significant in the Arctic • The former may provide better short-term projections, as measured by prediction of historical events, because historical record may inadequately sample key mechanisms • Doing both gives credibility to projections, esp. when true uncertainties are difficult to quantify
Progress in Hydrologic Projection in Alaska • Three approaches highlighted here: • Downscaled climate products and derived hydrologic fields • Improvement of cryospheric components of process-based, empirical, and complex models • Reducing uncertainty in observational record
Progress in Hydrologic Projection in Alaska: downscaled climate products and derived hydrologic fields • Scenarios Network for Alaska and Arctic Planning: • Statistically downscaled projections of temperature and precipitation for 5 IPCC models that perform best in Alaska available (AR4 done, AR5 in the works), 2km, 800 m, scenarios: B1, A1B, A2, Method: Delta using PRISM • Gridded, downscaled historical data available, 2 km, 800 m • Additional model parameters are being downscaled (wind) • Parameters that are not directly (or poorly) represented in the climate models are being derived (PET, snowfall, vegetation, permafrost distributions, growing season, etc.) • Selected periods of dynamical downscaling available from WRF runs
OBS PET (Hamon) ENSEMBLE MODEL Δ (2080-2099 minus 1980-1999) Figure: S. McAfee
OBS P-PET (Hamon) ENSEMBLE MODEL Δ (2080-2099 minus 1980-1999) Figure: S. McAfee
Progress in Hydrologic Projection in Alaska:improvement of cryospheric components Slide: B. Bolton
Timing, Magnitude and Pathways Spring snow melt period Growing season Autumn Slide: B. Bolton & J. Cable
NWS River Forecast Center Hydrologic Modeling Framework: Flood Early Warning System/ Community Hydrologic Prediction System Progress in Hydrologic Projection in Alaska:Reducing uncertainty in observational record Slide: K. Bennett
MODIS Snow Cover ExtentApril 1st, 2011 Slide: K. Bennett
MODIS Snow Cover ExtentMay 23rd, 2011 Slide: K. Bennett
SNOW-17/ SAC-SMA - RFC • SNOW-17, snow air temperature index model • SACramento Soil Moisture Accounting model, medium complexity, conceptual water balance model, run in lumped mode Anderson, 2006 Burnash, 1976 Burnash et al. 1973 Slide: K. Bennett
UAF-managed Total Precipitation ‘Hot Plate’ Sensor Network: alternative for environments where gauges perform poorly ATQASUK Bar Atq Olik Poker Flat Kougarok Umt Tlk Fox = potential future hot plate installations = other IARC snow research sites w/o TPS BARROW Used for in situ studies and validation of models WRF model comparison J. Cherry
MIT wind tunnel testing of ‘Hot Plate’, IR measurement, algorithm development, CFD modeling ~5 m/s X & Y Velocity fields ~10 m/s Images: J. Cherry, M. Itomlenskis (ARSC summer intern)
Digital Surface Models from Structure from Motion Algorithms
RECAP:Needs, Challenges, Progress in Hydrologic Projection in Alaska • Needs highlighted here: • Communities • Municipal, Rural, and Resource Land Managers • Technological Experts • Challenges: • Climate Change is most amplified in the Arctic • Climate Models do a poor job of representing many cryospheric processes such as permafrost dynamics, glacial change, river ice, changes in subsurface water storage, etc • The historical observations in this region are particularly sparse and short • Our technology for measuring solid precipitation works poorly and changes are difficult to detect • Progress highlighted here: • Downscaled climate products and derived hydrologic fields • Improvement of cryospheric components of process-based, empirical, and complex models • Reducing uncertainty in observational record
Questions? JCHERRY@IARC.UAF.EDU
SPRING (April-May) SUMMER (June-July) AUTUMN (Aug-Sept) Priestley-Taylor ( __ ) Hamon (…) Figure: S. McAfee