Heat Waves
The 1995 Heat Wave: How Likely is a Recurrence?. By: Thomas R. Karl & Richard W. Knight. Heat Waves. Contribution of Land-Atmosphere Coupling to Recent European Heat Waves. By: Kathryn Bullinger. By: Fischer, Seneviratne, Lüthi, & Schär. Double Major: Geography and Earth Sciences.


Heat Waves
E N D
Presentation Transcript
The 1995 Heat Wave: How Likely is a Recurrence? By: Thomas R. Karl & Richard W. Knight Heat Waves Contribution of Land-Atmosphere Coupling to Recent European Heat Waves By: Kathryn Bullinger By: Fischer, Seneviratne, Lüthi, & Schär Double Major: Geography and Earth Sciences Kathryn Bullinger Geography and Earth Sciences Double Major
Lets Start with the Basics: What are they? …(if the name alone isn’t enough of a clue…seriously.) • Defined: It is a prolonged period of excessive heat, often accompanied by excessive humidity. • Qualifications: • The weather is noticeably warmer than normal for the time of year and climate. • The unusual weather continues for a prolonged period of time long enough to be considered a specific phase. • The weather will most likely bring about some sort of increased risk to humans and animals, and may place an increased strain on power supplies.
How Does This Happen? • When an air mass becomes quasi-static/stationary over a region (and it meets all those qualifiers), it is labeled a heat wave.
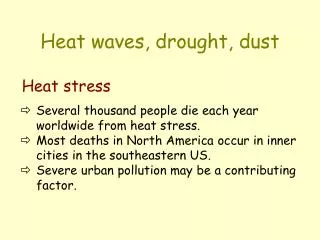
Why they are Dangerous: • Heat kills by taxing the body beyond its’ normal abilities. • On average, < 1000 Americans die heat-related deaths each year (as reported by the American Meteorological Society) • Heat waves kill more Americans than any other type of natural disaster.
Why they are Dangerous: Cont’d. • People who live in urban areas are at a greater risk from heat wave effects. • Stagnant atmospheric conditions trap pollutants. • Poor air quality aggravates health problems. • Asphalt and concrete store heat longer, which results in higher nighttime temperatures. • Known as the ‘urban heat islandeffect’.
The Chicago Heat Wave of ‘95: • July 12th - 16th, 1995. • Approximately 700 people died in just 5 days. • July 13th: • The temperature in the city hit 106° F. • Including the heat index, it felt hotter than 120° F. • Chicago’s infrastructure had a meltdown (almost literally). • Communities lost water pressure. • Train rails and roads buckled. • Paramedics, hospitals, and morgues overwhelmed. • Majority of deaths were elderly men who lived alone.
On to the 1st Paper! • The analysis: • Considers the apparent temperature, Tap, which attempts to quantify the effects of temp. and moisture on the human body. • “Focuses on the severity and duration of extreme heat waves relative to changes of mean T, variance, day-to-day persistence of T, and the cross correlations of these quantities.” • Also created future scenarios for heat waves of similar or greater intensity.
Notable Points that they Took into Account for their Analysis: • High dewpoints play a key role in high Tap values. • Minimum T may be especially important. • Deaths due to heat are greatest during the 1st few days of a heat wave. • Acclimatization factors also seem to be important.
Assessing the Wave: • Use the Tap algorithm developed by Steadman. • Tap values apply to shaded daytime conditions and night. • Focus on the the full distribution of hourly T’s during the 1st few days for 26 stations in and around the Chicago area.
Min, 25P, 50P, 75P, and Max T plotted for the warmest annual 1, 2, and 3-day events in Chicago history.
Calculated the average Tap for any 2-day period during the ‘95 heat wave to help delineate the aerial extent of the wave.
Used values from 1, 2, and 3-day intervals between June 15th and August 15th (the period of most intense summertime heat in the Midwest). “The analysis was performed for both observed Tap and those adjusted for the effects of the growth of the urban heat island.” Heat island adjustments applied based on the algorithm developed by Karl et al. “Used the algorithm to help develop an interval that would bound the effects of urbanization on T trends.” Calculating Trends of Tap
Applying the Algorithm • Assumed the hourly T’s at 1500 LT were associated with the max and T’s at 0600 LT with the min. • Started with a population of 0 for each urban area, with the final population estimate equal to the 1990 city census (“to provide an upper bound for the effect of urbanization on the trends of T.”
The Probability of Recurrence • 10,000 sequences on monthly July daily max and min values were simulated using various values of a 4-parameter model. • Mean Tap • Sa - the variance of monthly mean Tap calculated across years • Sm - the variance of Tap calculated for a given month using daily values • r - persistence coefficient of the daily Tap
“Using the simulated July values of daily max and min Tap, the probability of exceeding specific thresholds of T can be easily calculated relative to what actually occurred during 1995.”
The stationarity of Tap: The overall trends of Tap in the Midwest are more moderate than the Chicago results. However, the climate in the Midwest appears to be stationary. Sensitivity of the probabilistic model: Changes in mean Tap are important, but other parameters are also critical, such as persistence and variance. Recurrence for the ‘95 heat wave in the present climate: The probability of max Tap exceeding 48.9° C two consecutive days in a row is < 1%, or 1 in 150 years. The probability of having min Tap values above 31.6° C for two consecutive days is extremely rare. Recurrence for the ‘95 heat wave in a changed climate: Projected increases in T are by 3° C by the end of the next century due to greenhouse gases. Faster return periods for extreme T’s. Their Results Is there a looming doomsday in our future?
The Sensitivity of Multivariate and Univariate Changes Daily max Daily min
Their Summary • An event like the Chicago heat wave of ‘95 is quite rare, due to the elevated 2-day nighttime (min) temperatures. • Duration and intensity of heat waves have been shown to be affected by 4 parameters. • Min Tap probability results especially rare and unusual. • In their opinion, and event like the Chicago heat wave will not be repeated any time in the near future.
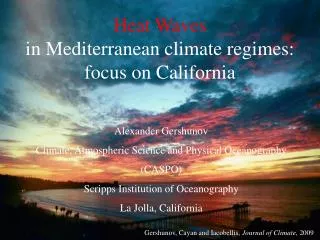
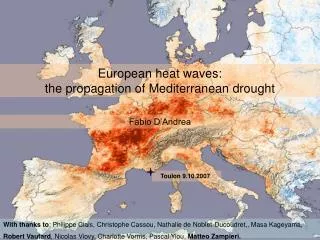
Guess What!? I’m Not Done Yet! Paper Number Two…omg • Most of the recent European heat waves have been preceded by a spring precipitation deficit. • Regional climate simulations conducted with and w/o land/atmosphere coupling for 4 major European heat waves; 1976, 1994, 2003, and 2005.
An Intro to European Heat Waves • 2003 heat wave record-breaking; over 40,000 deaths. • Crop shortages. • Forest fires. • These highlight the importance of understanding what causes these extreme events.
The Experiment: • Focuses on Europe and the north-eastern Atlantic. • Performs a 46-year simulation (1960-2005) with a coupled land-surface scheme (CL simulation). • Repeat the simulations for ‘76, ‘94, ‘03, and ‘05, but with soil moisture uncoupled from atmospheric evolution (UCL simulation). • NHD and HWD
1976: Confined to northern France and southern England > 35 hot days observed. 16-month period of precip. deficits prior. 1994: Affected central Europe and parts of the Mediterranean. Somewhat weaker on the seasonal scale. 2003: Record-breaking. Affected central Europe and the Mediterranean. 40-60 hot days observed. 2005: Confined to the Iberian Peninsula and southern France. Heat wave most pronounced in June. The 4 Major Waves
What the Figures Show Us: • “Based on these simulations, it can be seen that the NHD as well as the HWD is substantially reduced if the soil moisture is prescribed (or dictated) by climatological mean conditions (UCL simulations).” • T amplification through CL is stronger for daily max T’s than for min and mean T’s. • “CL interactions contribute to an enhanced diurnal T range.”
So Basically… • Each of the 4 waves was preceded by a mean precip. deficit of at least 4 months. • CL simulations show excess in surface net rad. leading to an increase in evaporation. • CL is found to increase mean max and min T’s over unusually warm summers.
There is no eminent danger of us being fried by a drastic spike in summer temperatures. Heat waves do happen, but they are very infrequent. Lack of precipitation plays a role in hotter temperatures for the approaching summer. Future Study: I would be curious to see if there is a connection to heat waves on different continents during the same year. I think some investigation into that could be interesting… My Thoughts…