Environmental Impact Assessment of Air Pollution During Deepwater Horizon Incident
10 likes | 79 Views
Study on PAH and OPAH air-water flux and toxicity impacts before, during, and after shoreline oiling from the Deepwater Horizon Incident. Significant changes in near shore air chemistry measured. Importance of quantifying chemical fate in oil spills shown. Utility of LDPE PSD for flux assessment established. Initial step in understanding environmental impacts.

Environmental Impact Assessment of Air Pollution During Deepwater Horizon Incident
E N D
Presentation Transcript
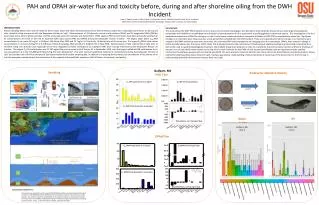
INTRODUCTION: Passive sampling devices were used to measure the air vapor phase and water dissolved phase at four Gulf of Mexico coastal sites. Sampling occurred prior to, during and after shoreline oiling concurrent with the Deepwater Horizon oil spill. Measurements of 33 polycyclic aromatic hydrocarbons (PAHs) and 22 oxygenated PAHs (OPAHs) were taken across all time points and sites, and flux across the water/air boundary was determined. While aqueous PAH concentrations have been previously reported, all air concentrations are some of the first to represent both vapor phase PAHs and OPAHs during the Deepwater Horizon incident. The largest vapor phase Σ33airPAH concentrations in air were 24.1ng/m3 in Gulfport, MS during May 2010 and 22.7ng/m3 in Grand Isle, LA during June of the same year. The largest Σ22OPAH vapor phase concentrations in air were 26.6ng/m3 in Gulf Breeze, Florida during May 2010 and 20.6 in Gulfport, MS in May 2010. Concentrations in May represented air data prior to shoreline oiling. The direction and magnitude of the time-integrated air-water exchange of 13 individual PAHs were strongly influenced by the Deepwater Horizon oil incident. The largest Σ13 PAH volatilization was 11,200 ng/m2/day and occurred in Gulf Shores, AL in September 2010, with the largest individual PAH volatilization to air was acenapthene at a rate of 6,820ng/m2/day during the same deployment. This work represent additional evidence of contamination during the Deepwater Horizon oil spill, but provides one of the first examples of flux determination with passive sampling data. In addition to impacting marine waters, the introduction of this volume of oil into this ecosystem combined with the combustion of this material had quantifiable impacts on Gulf of Mexico air chemistry and quality. Conclusions: This study shows the LDPE PSD should be a tool in every environmental investigators tool box due to their attributes of ease of use, wide range of sequestered compounds and flexibility in minable data from utilization of paired samplers for flux assessment to profiling general contaminate source. This investigation is the first quantitative assessment of PAH flux during an oil spill. Furthermore it demonstrated the successful utilization of LDPE PSD to quantitatively assess flux. Significant changes in air chemistry were measured over a time period that coincided with the DWH incident. There is strong evidence that the changes in air chemistry were related to the DWH incident at some near shore sites. Not only were PAH levels elevated but an emerging class of contaminates, OPAHs, were shown to change in profile and abundance over the course of this study. This study demonstrates the importance of simultaneously studying multiple environmental compartments as well as the need to quantify toxicologically important intermediate break down products in order to characterize the environmental transfer and fate of chemicals of concern in an oil spill. While many models on the fate of oil and oil chemicals for the DWH oil spill assumed volatilization was an important transfer and fate mechanism this pathway was generally not directly quantified.This work presents important data for near shore sites in the Gulf of Mexico and demonstrates a robust method for obtaining these data in future oil spills. Having a quantitative understanding of where chemicals of concern go in the environment is the first step in understanding potential environmental impacts from an oil spill. PAH and OPAH air-water flux and toxicity before, during and after shoreline oiling from the DWH IncidentLane G. Tidwell, Sarah E. Allan, Steven G. O’Connell, Kevin A. Hobbie, Brian W. Smith, Kim A. AndersonDepartment of Environmental & Molecular Toxicology1, Oregon State University, Corvallis, Oregon Gulfport, MS PAH Flux Sampling Embryonic Zebrafish Toxicity Σ33 PAH vapor phase in air (ng/m³) Σ13 PAH net flux (ng/m²/day) control environmental sample Σ33 PAH Freely dissolved in water (ng/L) Air Water Phenanthrene net flux (ng/m²/day) Gulfport, MS June-2 Gulfport, MS June-2 OPAH Flux Σ22 OPAH vapor phase in air (ng/m³) Σ7 OPAH net flux (ng/m²/day) % Occurrence % Occurrence Σ22 OPAH Freely dissolved in water (ng/L) Benzofluorenonenet flux (ng/m²/day) Yolk sac edema Total Mortality Pericardial edema Mortality at 24 hrs Eye malformations Jaw malformations Body axis deformity Snout malformation Snout malformation Pigmentation defect Brain tissue necrosis Notochord deformity Somite malformation Unresponsive to touch Swim bladder deflation Caudal fin malformation Otic nerve malformation Pectoral fin malformation Lack of circulation in regions Notochord deformity at 24 hrs Somite malformation at 24 hrs Delayed development at 24 hrs ACKNOWLEDGEMENTS: • This project was supported in part by awards P42 ES016465 and the associated Analytical Chemistry Facility Core, P30 ES000210 and R21 ES020120 from the National Institute of Environmental Health Sciences. The content is solely the responsibility of the authors and does not necessarily represent the official views of the NIEHS, the National Institutes of Health or Oregon State University. Sampling permit numbers: 10-011, 11-002, GUIS-2011-SCI-0042, GUIS 2010-SCI-0022