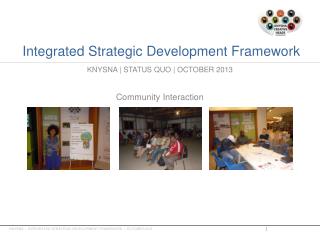
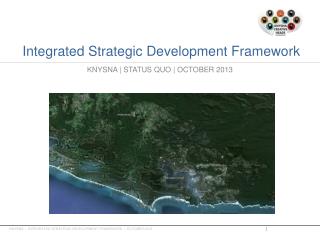
Integrated Strategic Development Framework
The Integrated Strategic Development Framework for Knysna, as of October 2013, examines key civil services including water, sewer, road, and stormwater infrastructure. The report assesses the current state of road networks, noting the length and condition of paved and unsurfaced roads, and highlights critical maintenance and upgrade needs. It also discusses stormwater management challenges, particularly flooding in specific areas, and traffic flow patterns impacting transportation infrastructure. This comprehensive analysis aims to guide future development efforts in Knysna.

Integrated Strategic Development Framework
E N D
Presentation Transcript
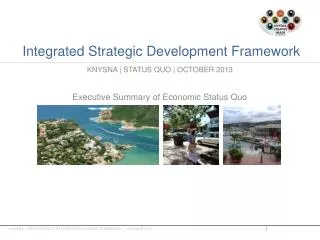
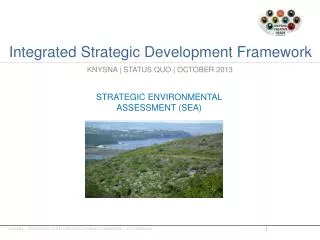
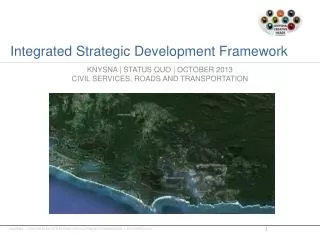
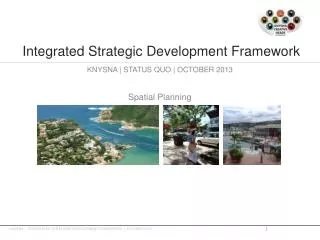
Integrated Strategic Development Framework KNYSNA | STATUS QUO | OCTOBER 2013 KNYSNA | INTEGRATED STRATEGIC DEVELOPMENT FRAMEWORK | OCTOBER 2013
Integrated Strategic Development Framework KNYSNA | STATUS QUO | OCTOBER 2013 CIVIL SERVICES CONTENTS • WATER INFRASTRUCTURE • SEWER INFRASTRUCTURE • ROAD INFRASTRUCTURE • STORMWATER INFRASTRUCTURE • TRANSPORTATION • SOLID WASTE KNYSNA | INTEGRATED STRATEGIC DEVELOPMENT FRAMEWORK | OCTOBER 2013
ROADS INFRASTRUCTURE GENERAL • The total length of the paved road network is approx. 245 km, consisting of a combination of tar, block paving and concrete. The total unsurfaced roads are approximately 53 km, defined as gravel roads and dirt roads. • The surfaced roads average condition was rated as poor to very poor, with 55% of the surfacing in this category. A further 11% of the roads show structural failure in the poor to very poor section. Cost estimated as per the V&V report for the remedial works in the short term (2 yrs) in regards to surfacing amounts to R 66m. Structural remedial works over a 5 year period is stated as R 55.5m. • The unsurfaced roads was rated as fair to good, with 15% of the roads falling in the poor to very poor category. The required maintenance on the roads is approx. R 230 000 and upgrading needs amounts to R 2.9m (dirt roads to gravel) • Many roads in the informal settlement such as Dam se Bos, Edameni, Hlalani, Sizamile, and Ethembeni are poor and relatively inaccessible, especially for medical and rescue services. KNYSNA | INTEGRATED STRATEGIC DEVELOPMENT FRAMEWORK | OCTOBER 2013
STORMWATER INFRASTRUCTURE • Stormwater flooding in the Knysna and Sedgefield areas was reported at regular intervals during the years. • One of the areas identified was the Bigai catchment area. The most affected areas within the flood zone are the Public open space (the area acting as the streambed of the Bigai stream), Knysna Golf Course, Wilson, Howard, Kennet, Thesen and Bolton Streets; George Rex Drive; Waterfront Drive; Clyde Street; and Knysna CBD Main Road. • It is difficult to draw definitive conclusions without extensive further investigation. A stormwater register indicating the existing infrastructure is required to evaluate and develop a stormwater management plan with a hydraulic stormwater model to determine the extent and cause to establish the upgrade extents of the pipe network. • With the information available it is apparent that the existing stormwater system is inadequate at various places in KLM, and will be compounded by new and future developments. • Various concerns were raised in the past in regards to pollution caused by stormwater outlets in the lagoon areas. Mitigating measures are to be put in place to prevent or minimized these occurrences. The figure below indicates the approximate extent of the flooding area in the Knysna CBD. KNYSNA | INTEGRATED STRATEGIC DEVELOPMENT FRAMEWORK | OCTOBER 2013
STORMWATER INFRASTRUCTURE KNYSNA | INTEGRATED STRATEGIC DEVELOPMENT FRAMEWORK | OCTOBER 2013
TRANSPORTATION KNYSNA • According to the latest available traffic counts : • 40% of west bound traffic originates from Waterfront drive and 60% originates from the CBD • 30% of the eastbound traffic is destined for Waterfront drive and 70% is destined for the CBD Traffic counts: • An AADT of count approximately 14941 was recorded with 10% heavy vehicles on the TR2/10 entering Knysna from the west • An AADT of count approximately 10178 was recorded with 5% heavy vehicles on the N2/8 past Old Place including traffic from Hornlee and from the Northern • An AADT of count approximately 3598 was recorded with 14% heavy vehicles on the TR59/1 connecting the northern suburbs and Avontuur with the N2 • An AADT of count approximately 7168 was recorded with 17% heavy vehicles on the N2 entering Knysna from the east • An AADT count of approximately 6846 was recorded with 15% heavy vehicles on the N2 passing through Sedgefield • An AADT count of approximately 1151 was recorded with 14% heavy vehicles on the MR355 connecting Rheenendal with the N2 KNYSNA | INTEGRATED STRATEGIC DEVELOPMENT FRAMEWORK | OCTOBER 2013
TRANSPORTATION • N2 East: The N2 section west of Knysna is considered one of the critical portions of the route through Knysna as the demand exceeds the existing capacity during holiday periods.. • N2 West: Sufficient capacity is available on this section of road. • Main Road: With the historic traffic counts, and applying a 4% growth the road have reached its capacity even during off season peak at this stage. • Waterfront Drive: The capacity of the road is estimated at 1 800 v/hr. Due to the saturation of Main Street, for the analysis of the traffic patterns the increased traffic within Knysna was assigned to Waterfront Drive. The implication thereof shows that Waterfront drive and the Main Road /Waterfront Drive intersection (east) will reach capacity in peak traffic periods. The below figures indicate the capacities as stated above. The sections indicated in RED represents areas where the road capacity have been reached. The ADDENDUM to this report indicates various proposals tabled to date in regards to the options to alleviate the traffic congestion in Knysna. KNYSNA | INTEGRATED STRATEGIC DEVELOPMENT FRAMEWORK | OCTOBER 2013
TRANSPORTATION ESTIMATED 2013 OFF-PEAK TRAFFIC VOLUMES KNYSNA | INTEGRATED STRATEGIC DEVELOPMENT FRAMEWORK | OCTOBER 2013
TRANSPORTATION ESTIMATED 2013 PEAK TRAFFIC VOLUMES KNYSNA | INTEGRATED STRATEGIC DEVELOPMENT FRAMEWORK | OCTOBER 2013
TRANSPORTATION NORTHERN AREAS LOOP ROAD • Approximately 50% of Knysna’ s population is in this areas and this route have long been identified as an important urban restructuring, beginning with the Northern Areas and Hornlee Gateway plan. • With the exception of a possible new link route between Bongani and the N2 through Heidevallei , and this likely to be expensive and comprise a number of hairpin bends, there is little opportunity to create more road links between the Concordia Road along the crest and the N2. • Only Wit Lokasie is within walking distance of Knysna CBD, Dam se Bos and Nekkies are seven to eight kilometres away. A key physical precondition to mobilize opportunities on this route include the geometric upgrading of the roadways and sidewalks to promote NMT and public transport. • Access to the northern areas is particularly bad and should be addressed. Grey Street is also prohibitively steep. The figure below show the northern areas loop road R 339 • The R339 represents an alternative route to Knysna. The condition thereof is poor and options should be investigated for the upgrading and improvement of the road. KNYSNA | INTEGRATED STRATEGIC DEVELOPMENT FRAMEWORK | OCTOBER 2013
TRANSPORTATION KNYSNA | INTEGRATED SPATIAL DEVELOPMENT FRAMEWORK | OCTOBER 2013
TRANSPORTATION ROAD SAFETY • Within the EDM, Knysna have the 2nd highest accident rate (2005-2012). The worst roads/sections identified (accidents/annum) as below: Main St reet (217.7) ; Concordia Road (43.4); Waterfront Drive, George Rex, TR059-1/R339 and DR1600/Brenton-N2 Mainst/Gray Street intersection was also indicated as a hazardous location • Further PRTMCC identified in 2011 the 6 worst pedestrian locations in the province. The N2 /Nekkies crossing was one of them with 25.3 accidents/annum, mainly pedestrians for the period 2000-2011. • Noted that the upgrading of the Nekkies intersection is tabled in the 2013/2014 budget. • Additionally the Hornlee access on N2/8 was also identified as hazardous in the study KNYSNA | INTEGRATED STRATEGIC DEVELOPMENT FRAMEWORK | OCTOBER 2013
TRANSPORTATION PUBLIC TRANSPORT TAXI SERVICES • The existing taxi services are administrated by 2 taxi associations namely the Knysna Taxi Association and Garden Route Taxi association. • There is one operational taxi rank located in Knysna (capacity 42) and it requires expansion • There are 4 major boarding and alighting points at Sanlam Mall, Hornlee and White Location. There are 5 local routes, with Rheenedal (route 869) being under supply. • Most ranks are informal with no relevant infrastructure and lack taxi embayments and shelters. • The average waiting time at loading areas is a maximum of 15 minutes in peak periods. Utilization varies from 20% -100%, with local routes Bongani, Concordia, Hornlee, Nekkies and White Location the busiest at 90-100%. • It was reported that approximately 50-70% of taxis operate without OLS (operating Licences). There is no impounding facility for illegal operators. The figure below shows the taxi routes KNYSNA | INTEGRATED STRATEGIC DEVELOPMENT FRAMEWORK | OCTOBER 2013
TRANSPORTATION KNYSNA | INTEGRATED STRATEGIC DEVELOPMENT FRAMEWORK | OCTOBER 2013
TRANSPORTATION PUBLIC TRANSPORT BUS SERVICES • There are no public bus services in Knysna. • Long distance bus operators serve the Cape Town – Durban routes. The pick up points are at the bus terminal (Marine Drive) and the Station. RAIL SERVICES • There are no passenger rail service serving the Knysna area, but infrastructure is existing at Brenton and Knysna stations. • The Choo-tjoe rail service was discontinued in 2006 due to flooding, and not reopened. • Suggestions to reopen the service to enhance Knysna facilities was made, no final outcome to date on said. • Other options like using the abandoned lines as bicycle routes and recreational walking routes were under consideration. AIR SERVICES • There is no airfield in Knysna. George airport is the gateway to Knysna. The Plettenbergbay airport being small do not lend itself to major commercial flights and this corridor is deemed as not a commercial viability for bringing in tourists to Knysna. KNYSNA | INTEGRATED STRATEGIC DEVELOPMENT FRAMEWORK | OCTOBER 2013
TRANSPORTATION PUBLIC TRANSPORT HARBOUR • From information available, the entrance into the harbour via The Heads is a dangerous passing and as such deemed not a serious commercial viability to develop to a greater extent NON MOTORIZED TRANSPORT • Approximately 52% of learners are walking to school. In the nine schools, 2822 learners have subsidised transport services. Approximately 38% (StatsSA) of all commuters walk to their destinations. • Serious consideration should be given to improving and creating NMT routes. • There is a general lack of safety measures and infrastructure for NMT between origin and destinations, especially along the N2. • It can be noted that the implementation of NMT will create job opportunities. A NMT Network and Implementation Plan was developed by the Pendulum /PDNA JV in 2007. KNYSNA | INTEGRATED STRATEGIC DEVELOPMENT FRAMEWORK | OCTOBER 2013
SOLID WASTE • Waste generation is approximately 21 000 ton/yr. domestic waste is 15 000 t/yr with the balance being building rubble, industrial waste and garden rubble. This equates to approx. 16.5 kg per household based on 17 500 households. • The municipality has sufficient capacity to collect refuse regularly on a weekly basis. This service is rendered to all residential areas which includes all informal areas in all the wards. • Access to informal plots in order to collect refuse is becoming a problem in the Northern Areas, with the uncontrolled development of informal houses. • Garden refuse sites is available in Knysna Transfer Station, Brenton-on Sea Landfill site and Sedgefield Landfill site, space is limited for this and a concern • Environmentally sensitive and waste not processed at the landfill sites is transported to Mosselbay via road. • Recyclable waste is taken to the recycling depot in Knysna, sorted and sold to recycling companies.. The below tables show facilities and waste generation The tables below show estimated waste generation and facilities KNYSNA | INTEGRATED SPATIAL DEVELOPMENT FRAMEWORK | OCTOBER 2013
SOLID WASTE KNYSNA | INTEGRATED SPATIAL DEVELOPMENT FRAMEWORK | OCTOBER 2013
TRANSPORTATION ADDENDUM KNYSNA | INTEGRATED STRATEGIC DEVELOPMENT FRAMEWORK | OCTOBER 2013
TRANSPORTATION ADDENDUM KNYSNA | INTEGRATED STRATEGIC DEVELOPMENT FRAMEWORK | OCTOBER 2013
TRANSPORTATION ADDENDUM KNYSNA | INTEGRATED STRATEGIC DEVELOPMENT FRAMEWORK | OCTOBER 2013
TRANSPORTATION ADDENDUM KNYSNA | INTEGRATED STRATEGIC DEVELOPMENT FRAMEWORK | OCTOBER 2013