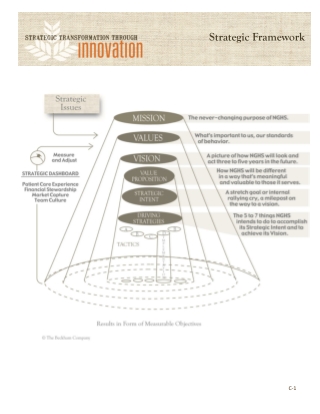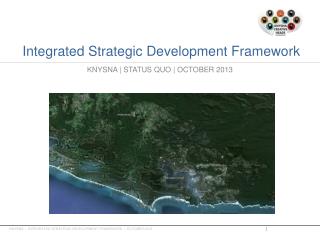
Integrated Strategic Development Framework
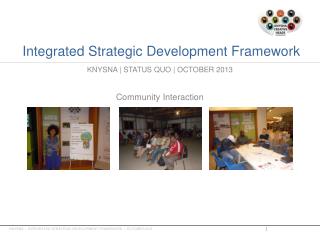
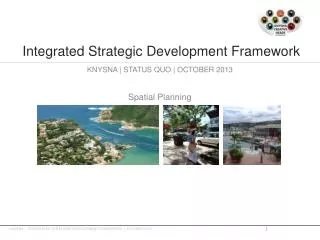
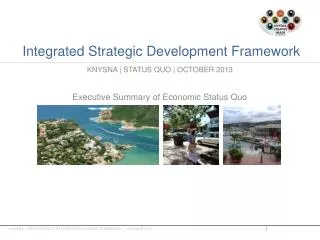
Integrated Strategic Development Framework. KNYSNA | STATUS QUO | OCTOBER 2013. Executive Summary of Economic Status Quo. KNYSNA | INTEGRATED STRATEGIS DEVELOPMENT FRAMEWORK | OCTOBER 2013. Report Format. 01 Introduction Introduction and Objectives; Data Sources

Integrated Strategic Development Framework
E N D
Presentation Transcript
Integrated StrategicDevelopment Framework KNYSNA | STATUS QUO | OCTOBER 2013 Executive Summary of Economic Status Quo KNYSNA | INTEGRATED STRATEGIS DEVELOPMENT FRAMEWORK | OCTOBER 2013
Report Format • 01 Introduction • Introduction and Objectives; Data Sources • 02 Development Enablers • Population Size, Location and Growth Rate; Education Structure and Growth Rate; Implications for planning • 03 Structure of the Knysna Economy • Current Realities; Sector Realities • 04 Summary and Conclusion • Outcomes Summary; Way Forward
01DEVELOPMENT ENABLERS 01-01 POPULATION CHANGE AND ITS IMPACTS POPULATION CHANGE • Population of Knysna as of 2011 was 68 659 • Seven forecasting models were use to estimate the population in 2030: 86 444 65 65 WAS THE AVERAGE NUMBER OF RESIDENTS PER SQ. KILOMETRE IN 2011 HOW THIS IMPACTS PLANNING • The Knysna economy will be required to create a minimum of 8 450 new jobs by 2030 in order to maintain current unemployment rates (15.5%). • Approximately 15 749 new jobs will need to be created by the economy over the period to absorb the growth in the working population by 2030. • There will be an estimated 5 671 new households in the municipality by 2030. • These new households will positively affect the rates base but will place added pressure on infrastructure. • The increasing population could potentially inject as much as R 760.3 million (2011 prices) in new spending into the economy by 2030. 3.1 AVG CONSUMPTION EXPENDITURE 3.1 WAS THE AVERAGE NUMBER OF PEOPLE PER DWELLING IN 2001 R1.9B 12% 33% 2011 R 1.9 BILLION IS THE TOTAL ANNUAL VALUE OF FINAL CONSUMPTION EXPENDITURE BY KNYSNA HOUSEHOLDS IN 2011 12% OF TOTAL ANNUAL KNYSNA HOUSEHOLD EXPENDITURE IS SPENT ON TRANSPORT 33% POPULATION GROWTH BETWEEN 2001 AND 2011 INKNYSNA R410M R410 MILLION IS THE TOTAL ANNUAL VALUE OF EXPENDITURE SPENT ON FOOD & BEVERAGES BY KNYSNA HOUSEHOLDS KNYSNA | INTEGRATED STRATEGIS DEVELOPMENT FRAMEWORK | OCTOBER 2013
01DEVELOPMENT ENABLERS 01-02 EDUCATIONAL CHANGES AND THEIR IMPACTS EDUCATIONAL ENVIRONMENT • Knysna has approximately 23 learning institutions comprising: • These accommodate approximately 12 127 pupils in 442 classrooms • The percentage of the population with higher education rose by 1.3% between 2001 and 2011 HOW THIS IMPACTS PLANNING • Between 90 and 120 additional classrooms will be required to cater for new primary and secondary school learners by 2030. • There would also be a potential 10 185 students eligible for undergraduate studies and 21 728 students eligible for postgraduate studies in 2030. • A resident with lower than Grade 12, has an average annual income of R 28 416. This is 8.3 times lower than a resident who has attainted higher education (R 236 877) • A 2% improvement in the number of individuals with some form of tertiary education by 2030, could increase individual earnings by an estimated R 285 million (2011 prices). +R285 MILLION POTENTIAL INCREASE, IN 2011 PRICES, IN INDIVIDUAL EARNINGS AS A RESULT OF IMPROVEMENTS IN EDUCATIONAL ATTAINMENT KNYSNA | INTEGRATED STRATEGIS DEVELOPMENT FRAMEWORK | OCTOBER 2013
02STATE OF THE KNYSNA ECONOMY 02-01 CURRENT REALITIES R2.47BILLION IN 2011, THE TOTAL REAL GDP-R IN CONSTANT 2005 PRICES, OF THE GREATER KNYSNA ECONOMY, A 81% INCREASE FROM 2001 Six of the ten economic sectors as well as the accommodation and catering sub-sector grew by over 6.1% per year over the 2001 to 2011 period. These sectors collectively employ 14 298 people and account for 68% of the municipalities total GDP-R. The transport and communications sector as well as the manufacturing sector have exhibited the lowest growth over the period – 1.2% and 3.2% respectively KNYSNA | INTEGRATED STRATEGIS DEVELOPMENT FRAMEWORK | OCTOBER 2013
02STATE OF THE KNYSNA ECONOMY 02-01 CURRENT REALITIES • The collective results from the various analyses show that the following sectors have been of historical importance to the Knynsa economy and are likely to continue to be so in the future: • Wholesale and retail trade • Catering and accommodation services • Construction • Financial and business services KNYSNA | INTEGRATED STRATEGIS DEVELOPMENT FRAMEWORK | OCTOBER 2013
02STATE OF THE KNYSNA ECONOMY 02-02 SECTOR REALITIES AGRICULTURE • Minor sector whose principle driver has historically been the timber industry • Timber industry has shown a decline over the period; timber cluster to address this • High value niche crop production (berries, nuts) is being explored while Karatara is being investigating for hydroponics MANUFACTURING • Historically important and linked to timber industry • Industrial space available and affordable but electricity costs perceived to be high which is inhibiting development • Rising industries: boat building, vintage car restoration FINANCE AND BUSINESS SERVICES • Important employer and contributor to GDP-R • Importance linked to the real-estate sub-sector and construction sector (engineers, architects, town planners) TRADE • Critically important sector to the Knysna economy incorporates the tourism industry (proxy: catering and accommodation) • Unique festivals in the municipality which attract significant number of domestic and international tourists • Key tourist assets: natural environment, festivals • Potential Anchor project: Discovery Park with significantly boost tourist numbers CONSTRUCTION • Growth has been slow with no major developments currently underway (economic conditions) • Developers indicated that the R 80 000 augmentation fee per stand make it prescriptively expensive to developed houses in the R 450 000 to R 500 000 price range • Entry level property in Knysna is +/- R 900 000; Average house prices range between R 1.2 million and R 2 million KNYSNA | INTEGRATED STRATEGIS DEVELOPMENT FRAMEWORK | OCTOBER 2013
02STATE OF THE KNYSNA ECONOMY 02-03 BARRIERS AND PROMOTERS OF GROWTH PROMOTERS • Knynsa strong employment growth, in a region where job growth has been slow, suggests that city-specific factors are promoting job creation • On average, businesses pay lower compensation per employee than other parts of the Eden district. This labour cost discount encourages job creation in the municipality. BARRIERS • Since housing is a households’ second largest expense after food, it is likely that the municipality high housing result in higher labour costs offsetting any discount • Secondly, commercial rents are higher in Knysna, on average than other parts of the Eden District. This premium further discourages job creation. However this commercial space premium is somewhat offset by the labour cost discount • Thirdly, the municipality there is a perception amongst businesses that the electricity prices are too high which is discouraging investment KNYSNA | INTEGRATED STRATEGIS DEVELOPMENT FRAMEWORK | OCTOBER 2013
03SUMMARY AND CONCLUSION IMPORTANCE OF TOURISM TO THE ECONOMIC LIFEBLOOD OF THE KNYSNA LOCAL MUNICIPALITY • The tourism industry is the critical foundation on which the Knysna Local Municipality’s economy is built. • The performance of the tourism industry is dependent on a range of external factors beyond the control of the local municipality. PERCEIVED COST OF DOING BUSINESS IN THE KNYSNA LOCAL MUNICIPALITY IS HIGH RELATIVE TO OTHER AREAS • Many businesses within Knysna perceive that it is more costly to start and run a business than other areas • There is also a widely held perception that the cost of electricity for businesses isfar too high compared to other areas. HOUSING PRICES COULD BE LEADING TO THE IMMIGRATION OF INDIVIDUALS • Luxury holiday homes coupled with the shortage of space for new developments in preferred areas, has distorted housing prices and resulted in entry level property for first time home buyers costing in the region of R 2 million. BROADENING THE ECONOMIC BASE AS WELL AS THE DIVERSITY OF THE ECONOMY IS CRITICAL FOR FUTURE ECONOMIC DEVELOPMENT • Although the Knysna economy is fairly diverse, it has become more concentrated since 2001 as evidenced by the municipality’s Tress Score which has increased from 47.6 in 2001 to 49.2 by 2011. KNYSNA LOCAL MUNICIPALITY HAS SEVERAL FACTORS THAT MAKE IT AN ATTRACTIVE DESTINATION FOR VISITORS AND TO A LESSER EXTENT BUSINESS KNYSNA | INTEGRATED STRATEGIS DEVELOPMENT FRAMEWORK | OCTOBER 2013