Download
1 / 19
190 likes | 404 Views
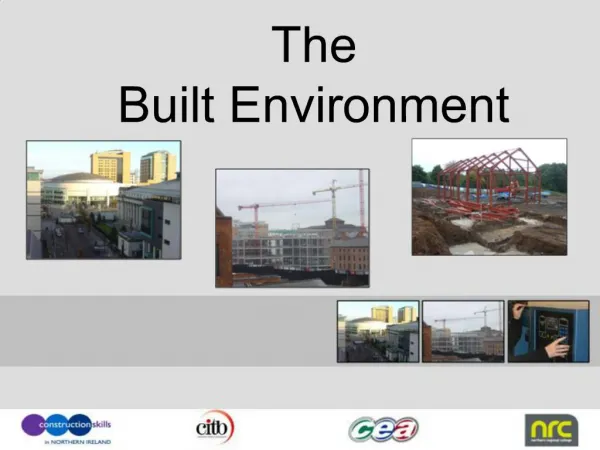
The Role of the Built Environment in Active Transportation. Andrew T. Kaczynski PhD Candidate Department of Recreation and Leisure Studies University of Waterloo Physical Activity Resource Centre Conference Toronto, Ontario February 6, 2007. Presentation Outline.

E N D
The Role of the Built Environment in Active Transportation Andrew T. Kaczynski PhD Candidate Department of Recreation and Leisure Studies University of Waterloo Physical Activity Resource Centre Conference Toronto, Ontario February 6, 2007
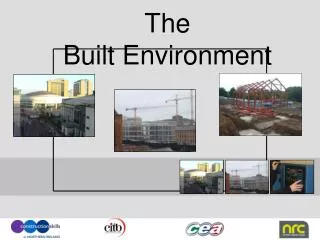
Presentation Outline • Briefly discuss social ecological models of physical activity (PA) promotion. • Review associations between PA and the built environment. • Examine the role of the built environment in active transportation.
Just a bit about Andy … • PhD Candidate, Department of Recreation and Leisure Studies, University of Waterloo • Graduate of the University of Waterloo (BA) and Texas A&M University (MSc) • Love teaching and research • Member of City of Waterloo RLS Advisory Comm. • Previously employed with the YMCA of Toronto and a private municipal consulting and planning firm • A (fair-weather) practitioner of active transportation!
Physical Activity • In 2000, 56% of Canadians and 57% of Ontarians were insufficiently active to achieve health benefits (CFLRI, 2002) • Among top three preventable causes of mortality (World Health Organization, 2005) • Linked to lower all cause mortality(Paffenbarger et al., 1986), reduced risk of cancer(Stein & Colditz, 2004),cardiovascular disease(Ball & MacCargar, 2003),diabetes(Bassuk & Manson, 2005), and osteoporosis(Kemper et al., 2000), and improved mental health(Paluska & Schwenk, 2000) • A growing public health priority (Active 2010; Healthy People 2010)
Stages of PA Research(Sallis, Linton & Kraft, 2005) • Pre-1970: Physiological studies of physical activity (exercise) and fitness • 1970-1990s: Epidemiological research about physical and behavioural influences on exercise • 1970-1990s: Interventions targeted mainly at changing individual physical activity behaviour • Knowledge (e.g., mass media campaigns) • Self-efficacy • Social support • Late 1990s, early 2000s: Environmental influences and interventions to promote active living
Active Transportation • Any form of self-generated (i.e., non-motorized) method of transportation … • - Go For Green Walk and Roll Guide • For example: • walking/jogging • cycling • rollerblading • skating • Principles: • portions of trips count • avoiding and minimizing dependence on motorized modes of transport • multi-modal travel encouraged (e.g., bike & bus) Photo courtesy Envirozine
Social Ecological Models of Physical Activity Promotion • Increasing criticism of individually-focused explanations and interventions for PA promotion (Marcus et al., 1999; Sallis et al., 2002) • Principles of S-E models (Sallis & Owen, 2002): • Behaviour is a function of the individualand his or her environment. • Multiple levels of influence must be addressed to successfully change complex behaviours. • e.g. personal, interpersonal, environmental, policy, etc. • Multiple sectors/disciplines must be involved and should coordinate their efforts.
Social Ecological Models of Physical Activity Promotion Source: Sallis et al. (2006). In Annual Review of Public Health, 27, 297-322.
Environmental Influences on Physical Activity • Land-use diversity • mixture of residential and commercial zoning • nearby shopping and other amenities • Transportation and planning variables • sidewalks, public transit • connectivity of streets, etc. • Safety from crime, traffic • Aesthetics • Parks and recreation amenities • Sources:Humpel et al., 2002; McCormack et al., 2004; Owen et • al., 2004; Saelens et al., 2003; Sallis et al., 1998 Photo courtesy www.thehillsofheadwaters.com
PA and Urban Form Frank, L.D., Schmid, T.L., Sallis, J.F., Chapman, J., & Saelens, B.E. (2005). Linking objectively measured physical activity with objectively measured urban form: Findings from SMARTRAQ. American Journal of Preventive Medicine, 28(2S2), 117-125. • 357 participants from high and low res. density areas • Wore accelerometers for 2 days to track PA • Urban form walkability index: Combination of res. density, street connectivity, and land-use mix within 1 km (along road network) of each participant’s home • Each higher quartile on the walkability index was 30% more likely to engage in 30+ minutes of PA per day
Cycling and the Built Environment Vernez Moudon, A. et al. (2005). Cycling and the built environment. Transportation Research Part D, 10, 245-261. • 608 participants from King County, WA split into cyclists (at least once/week) and non-cyclists • 128 (21.3%) classified as cyclists • Cycling significantly related to several factors in the built environment: proximity to trails; presence of bike lanes on streets; presence of destinations in n’hood • Experience in Europe suggests cycling can be promoted successfully (Netherlands=27% trips by bike) Photo courtesy Richard Durdl
Active Transportation and Youth Timperio, A., Crawford, D., Telford, A., & Salmon, J. (2004). Perceptions about the local neighborhood and walking and cycling among children. Preventive Medicine, 38(1), 39-47. • 5-6 and 10-12 year olds in Melbourne (N=1210) • No parks or sports venues nearby (parents responded for 5-6 year olds, 10-12 yr olds’ self-perceptions) • Examined parents’ reports of whether child walked or cycled to destinations (e.g., playground, school) at least 3 times/week • Lower odds of walking/cycling for older kids reporting no nearby parks, but no difference among younger age group
Andy’s Research: Overview • Four planning districts in Waterloo: core, suburb, two areas about 40 years old • 585 participants (18 years+) • Questionnaire about personal, psycho-social, and neighbourhood factors related to physical activity • Detailed 1-week log booklet of PA episodes: • Activity, duration, intensity • Location description (home, n’hood, park, etc.) • Method of transport, purpose
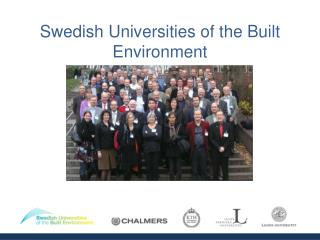
Andy’s Research: Study Areas Beechwood Central
Andy’s Research: Active Transportation in Waterloo • 5718 total episodes of PA reported by 585 participants • Recreation – 54.1% (includes exercise) • Job-related – 7.2% • Household – 28.2% • Transportation – 10.4% (590 episodes) • 163 distinct people (27.9% of total sample) • 58% walk, 37% bike, 5% other • Mean of 26.5 minutes per episode • Neighbourhood of residence: Eastbridge – 7%, • Beechwood – 23%, Willowdale – 21%, Central – 49% • 76.9% of episodes in neighbourhood (all or part) • 18% of episodes included use of a park or trail • 5% park, 7% trail, 6% park and trail
Active Transportation and Trails Troped, P.J., et al. (2003). Correlates of recreational and transportation physical activity among adults in a New England community. Preventive Medicine, 37, 304-310. • 413 adults from suburb of Boston (60% female) • Measured minutes per week of combined walking and biking to get to and from places • Measured distance from homes to trail access point • Distance to rail-trail not related to recreational PA, but significantly related to transportation PA • Every mile further away from trail related to 64 • minutes less transportation-related PA per week
Trails and Active Transportation • Economic, health, social, and environmental benefits • Connectivity important • Barrier-free • Regular maintenance necessary • Maps and educational displays valuable • www.ontariotrails.on.ca
Conclusion • Various aspects of the built environment have a potentially significant contribution to make to promoting physical activity and active transportation • Need more research, especially with youth, on projects happening across Ontario • Need more collaboration • Between professionals and academics • Across disciplines and departments
Andrew T. KaczynskiPhD CandidateDepartment of Recreation and Leisure StudiesUniversity of Waterlooatkaczyn@ahsmail.uwaterloo.ca Thank You